
Research · Phase 1 human trial · 28 Sep 2026 analysis
Low-Dose Psilocybin:
What the Pupils Tell Us
Perceptible effects, cognitive tests and an uneven pupil response across doses. A closer look at 56 healthy adults given a single dose.
Study published 21 Sep 2026 · Pharmaceuticals (MDPI)
AkashicNET analysis · Research findings
Perceptible does not necessarily mean impaired.
The study compared single oral doses of pure psilocybin, from 0.5 to 4 mg, with placebo. Subjective effects became distinguishable from placebo at doses of 2.5 mg and above. The cognitive tests did not show a dose-dependent decline, but that does not demonstrate that every participant was unaffected or that these doses are suitable for everyday activities.
Participants included 28 men and 28 women, with a mean age of 37.5 years (SD 10.2). Each active dose had six participants, except 4 mg, which had twelve across two cohorts. Eligibility was limited to healthy adults aged 18–55, with substantial medical, psychiatric and prior psychedelic-use exclusions.
Four milligrams is twice 2 mg and four times 1 mg. That arithmetic does not establish a universal microdosing “sweet spot”. This trial did not identify an optimal therapeutic microdose, and milligrams of pure psilocybin are not milligrams of dried mushrooms.
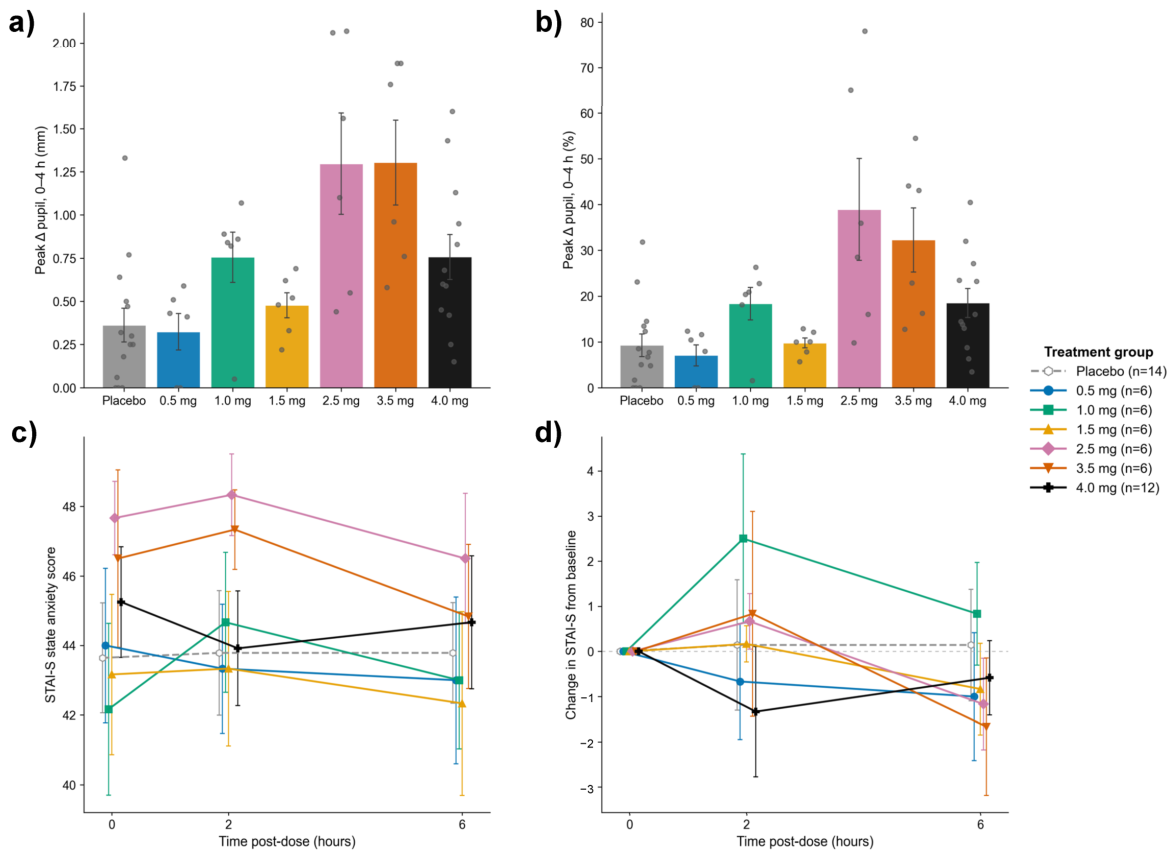
Section 2.7 · Figure 8a–b
Pupil dilation: the average fell at 4 mg.
These are the mean peak changes from baseline within the first four hours, using the exact values reported in the article’s results text.
| Dose | Participants | Mean peak dilation | Mean increase |
|---|---|---|---|
| Placebo | 14 | +0.31 mm | +8% |
| 1 mg | 6 | +0.75 mm | +18% |
| 2.5 mg | 6 | +1.30 mm | +39% |
| 3.5 mg | 6 | +1.30 mm | +32% |
| 4 mg | 12 | +0.76 mm | +19% |
Selected values: Section 2.7 does not give exact peak numbers for the 0.5 mg and 1.5 mg groups, so they are not estimated here from the chart. Percentages are reported separately; they should not be used to infer a shared baseline diameter.
Across participants, peak dilation correlated with dose (Spearman ρ = 0.46; p = 0.0004 for the change in millimetres). However, the group averages did not increase at every dose: 4 mg produced less mean peak dilation than 2.5 or 3.5 mg.
These were different groups of people, not the same participants tested repeatedly at increasing doses. The study does not report a direct significance test of the 3.5-versus-4 mg difference. Sampling variation, baseline differences and individual sensitivity remain possible explanations; the graph does not establish a physiological turning point.
Source consistency note: the placebo bars in Figure 8 appear slightly higher than the +0.31 mm / +8% stated in Section 2.7. The table retains the written values rather than substituting estimates from the image.
Community observations · Hypothesis, not a study finding
The uncomfortable “in-between” dose?
Members of r/microdosing have described an uncomfortable come-up or body load at a dose above their comfortable microdose but below what they call a “museum dose”. Reports include lights feeling too bright and an adrenaline-like sensation. See FAQ/Tip 005.
The pupil pattern raises an interesting question alongside those reports, but this study did not establish a relationship between pupil dilation and that discomfort. “Adrenaline-like” describes a feeling, not a measured adrenaline result. Slight dilation is not a validated safety marker, and the lower average at 4 mg is not a reason to increase a dose to avoid body load.
Fadiman and Gruber have also described anecdotal reports of some autistic people using higher doses. This trial provides no autism-specific breakdown and cannot test that explanation. Autism or neurotype should not be inferred from someone’s pupil response or apparent tolerance. Read Gruber’s book-update discussion.
Limits and context
What remains unanswered
- Small dose groups limit precision. Pharmacodynamic analyses were exploratory, with descriptive p-values uncorrected for multiple comparisons.
- No detected group-level cognitive decline is not proof of no individual impairment or fitness to drive.
- A single-dose study cannot establish repeated-dose safety or therapeutic benefit. No serious adverse events occurred, but mild adverse events were recorded, including one hallucination report at 4 mg.
- The study was funded by Diamond Therapeutics. The article reports retrospective trial registration on 17 July 2026 (NCT07710027).
Useful next questions include whether the pupil pattern replicates, how individual changes relate to subjective discomfort, and whether findings persist with repeated doses. The present results do not settle those questions.
Original paper · Abstract reproduced
A Randomized, Double-Blind, Placebo-Controlled Single-Ascending-Dose Study to Identify a Subperceptual Dose of Psilocybin in Healthy Adults
Background/Objectives
Psilocybin shows therapeutic promise for several psychiatric disorders, but the acute perceptual and cognitive alterations produced by conventional doses (10–25 mg) require in-clinic supervision, which limits scalability. Whether the therapeutically relevant pharmacology of psilocybin can be safely separated from its hallucinogenic activity remains unresolved. To address this gap, we conducted a Phase 1, randomized, double-blind, placebo-controlled, single-ascending-dose study to characterize the safety, pharmacokinetics, and pharmacodynamics of low doses of psilocybin.
Methods
Fifty-six healthy adults received a single oral dose of psilocybin (0.5, 1.0, 1.5, 2.5, 3.5 or 4.0 mg) or matching placebo across seven sequential cohorts, with each dose escalation reviewed by a Drug Safety Review Committee. All participants completed the study with no serious adverse events or discontinuations.
Results
Treatment-emergent adverse events were comparable to placebo and most prominently arose as somnolence. Plasma psilocin appeared rapidly with a median time to maximum concentration <1 h with dose-proportional exposure and a short terminal half-life. Subjective drug effects were dose-related and became distinguishable from placebo at doses ≥2.5 mg. Peak subjective ratings increased with dose, while altered-state scores remained low and cognitive changes did not differ from placebo. Psychophysiological engagement was confirmed by a clear dose-dependent pupillary dilation, while cognitive performance (attention, vigilance, working memory, impulse control) showed no dose-dependent decrement, and state anxiety did not increase at any dose.
Conclusions
These findings suggest that low-dose psilocybin may produce perceptible pharmacological effects without significant perceptual alterations or cognitive impairment. The results also offer preliminary support for considering controlled outpatient Phase 2 studies assessing the safety and feasibility of repeated, self-administered low-dose psilocybin. Retrospective ClinicalTrials.gov Registration on 17 July 2026 #NCT07710027.
Original paper · Two tables
Participants and adverse events
Table 1. Participant demographics and baseline characteristics.
| Characteristic | 0.5 mg (n = 6) | 1.0 mg (n = 6) | 1.5 mg (n = 6) | 2.5 mg (n = 6) | 3.5 mg (n = 6) | 4.0 mg (n = 12) | Placebo (n = 14) | Total (N = 56) |
|---|---|---|---|---|---|---|---|---|
| Age, years, mean (SD) | 32.8 (9.5) | 35.8 (11.4) | 32.3 (6.7) | 36.5 (12.3) | 33.0 (9.7) | 43.8 (8.6) | 39.5 (10.2) | 37.5 (10.2) |
| Sex, n (%) | ||||||||
| Male | 3 (50.0) | 2 (33.3) | 3 (50.0) | 3 (50.0) | 2 (33.3) | 7 (58.3) | 8 (57.1) | 28 (50.0) |
| Female | 3 (50.0) | 4 (66.7) | 3 (50.0) | 3 (50.0) | 4 (66.7) | 5 (41.7) | 6 (42.9) | 28 (50.0) |
| Race, n (%) | ||||||||
| Asian | 4 (66.7) | 0 | 0 | 1 (16.7) | 0 | 3 (25.0) | 4 (28.6) | 12 (21.4) |
| Black | 1 (16.7) | 3 (50.0) | 2 (33.3) | 2 (33.3) | 2 (33.3) | 4 (33.3) | 4 (28.6) | 18 (32.1) |
| White | 1 (16.7) | 3 (50.0) | 4 (66.7) | 3 (50.0) | 4 (66.7) | 5 (41.7) | 6 (42.9) | 26 (46.4) |
| Ethnicity, n (%) | ||||||||
| Hispanic/Latino | 1 (16.7) | 2 (33.3) | 2 (33.3) | 3 (50.0) | 1 (16.7) | 1 (8.3) | 1 (7.1) | 11 (19.6) |
| Not Hispanic/Latino | 5 (83.3) | 4 (66.7) | 4 (66.7) | 3 (50.0) | 5 (83.3) | 11 (91.7) | 13 (92.9) | 45 (80.4) |
| BMI, kg/m 2 , mean (SD) | 24.38 (3.04) | 25.47 (4.89) | 27.32 (3.68) | 24.80 (3.35) | 23.55 (1.50) | 27.34 (3.23) | 27.87 (4.53) | 26.28 (3.86) |
SD, standard deviation; BMI, body mass index. Percentages use the number of participants per treatment group as the denominator.
Table 2. Treatment-emergent adverse events by preferred term and dose (safety population).
| Preferred Term, n (%) | 0.5 mg (n = 6) | 1.0 mg (n = 6) | 1.5 mg (n = 6) | 2.5 mg (n = 6) | 3.5 mg (n = 6) | 4.0 mg (n = 12) | Placebo (n = 14) | Total (N = 56) |
|---|---|---|---|---|---|---|---|---|
| Any TEAE | 2 (33.3) | 2 (33.3) | 2 (33.3) | 3 (50.0) | 2 (33.3) | 6 (50.0) | 6 (42.9) | 23 (41.1) |
| Somnolence | 2 (33.3) | 0 | 2 (33.3) | 2 (33.3) | 0 | 2 (16.7) | 5 (35.7) | 13 (23.2) |
| Dizziness | 0 | 1 (16.7) | 0 | 0 | 1 (16.7) | 1 (8.3) | 1 (7.1) | 4 (7.1) |
| Headache | 0 | 0 | 0 | 1 (16.7) | 0 | 1 (8.3) | 0 | 2 (3.6) |
| Euphoric mood | 0 | 0 | 0 | 0 | 1 (16.7) | 2 (16.7) | 0 | 3 (5.4) |
| Nausea | 0 | 1 (16.7) | 0 | 1 (16.7) | 0 | 0 | 0 | 2 (3.6) |
| Vision blurred | 0 | 0 | 0 | 0 | 0 | 1 (8.3) | 1 (7.1) | 2 (3.6) |
| Hallucination | 0 | 0 | 0 | 0 | 0 | 1 (8.3) | 0 | 1 (1.8) |
| Hypervigilance | 0 | 1 (16.7) | 0 | 0 | 0 | 0 | 0 | 1 (1.8) |
| Dry eye | 0 | 0 | 0 | 0 | 0 | 0 | 1 (7.1) | 1 (1.8) |
| Fatigue | 0 | 0 | 0 | 1 (16.7) | 0 | 0 | 0 | 1 (1.8) |
| Sluggishness | 0 | 0 | 0 | 0 | 0 | 1 (8.3) | 0 | 1 (1.8) |
| Rash | 0 | 0 | 0 | 0 | 0 | 0 | 1 (7.1) | 1 (1.8) |
TEAE, treatment-emergent adverse event. All events were mild in severity and considered related to study drug. Events were coded with MedDRA version 24.0; percentages use the number of participants per group as the denominator.
Original paper · Eight figures
Figures and full captions
Open an image for its full resolution. Figures 1–7 load from the publisher; Figure 8 is also hosted here.
Figure 1
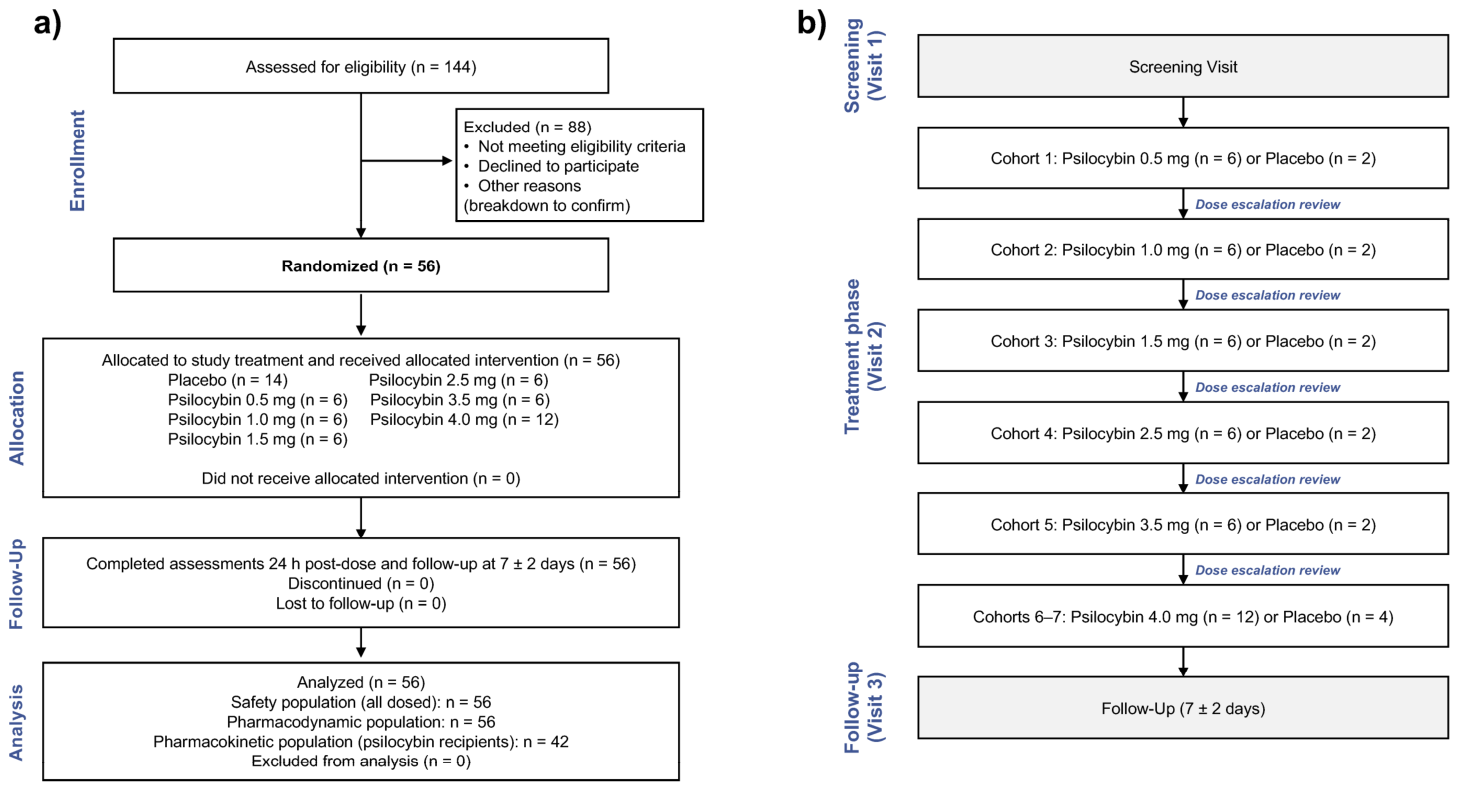
Editorial clarification: the source caption says “n = 12 each” for the repeated 4 mg dose. Section 2.1 and Table 1 report 12 active recipients in total across two cohorts, six in each. The source caption is reproduced unchanged.
Figure 2
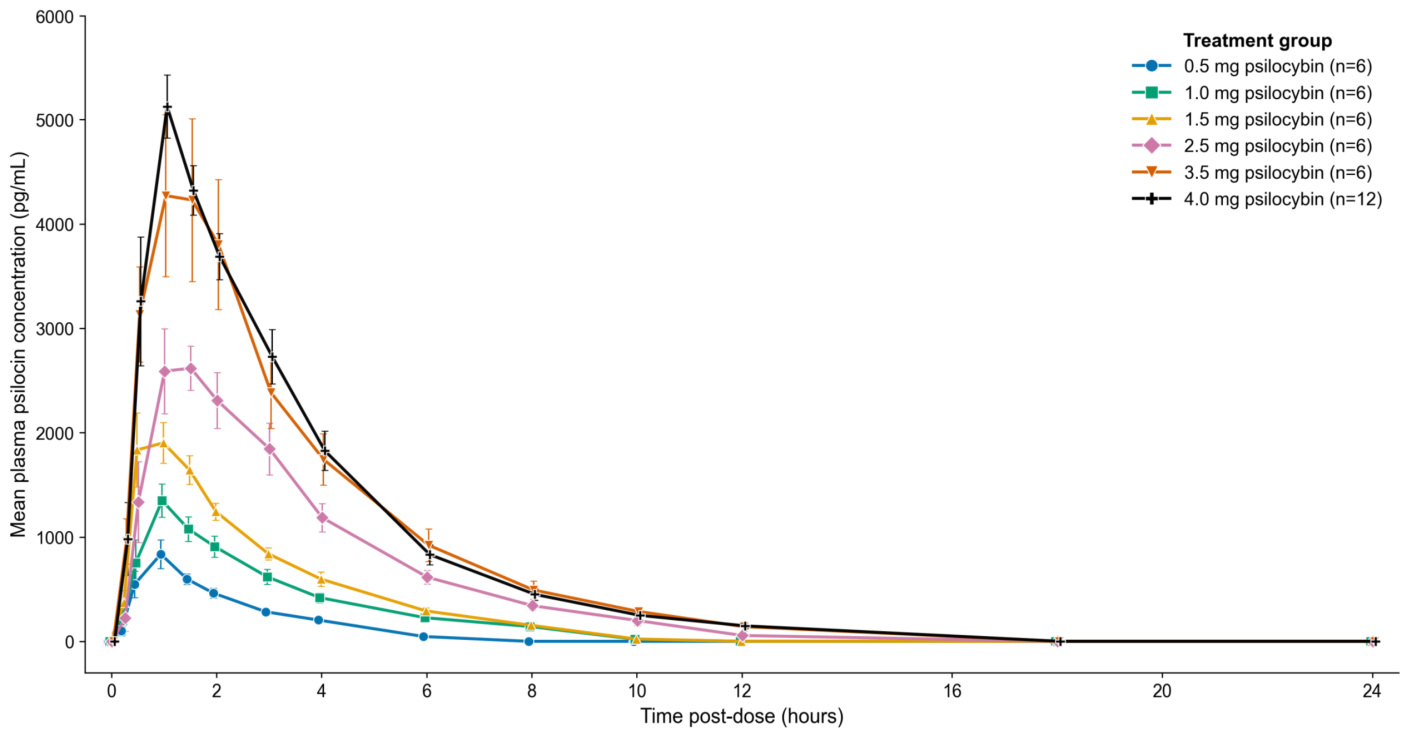
Figure 3
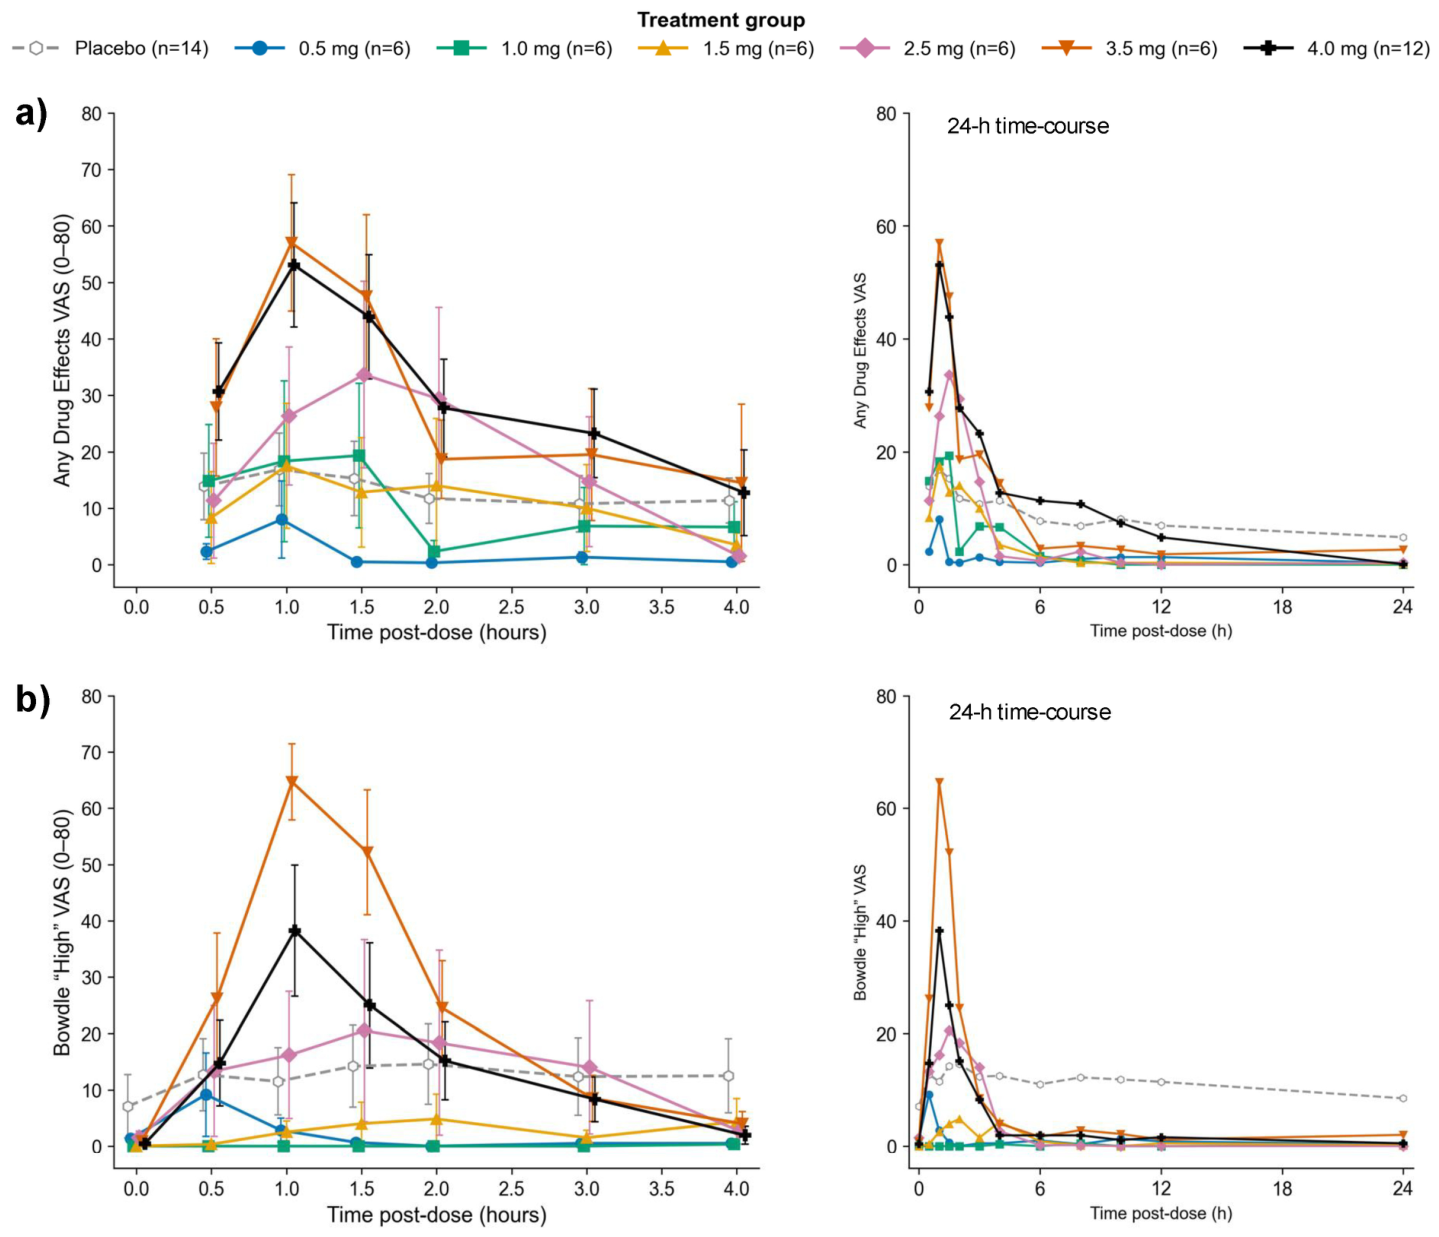
Figure 4
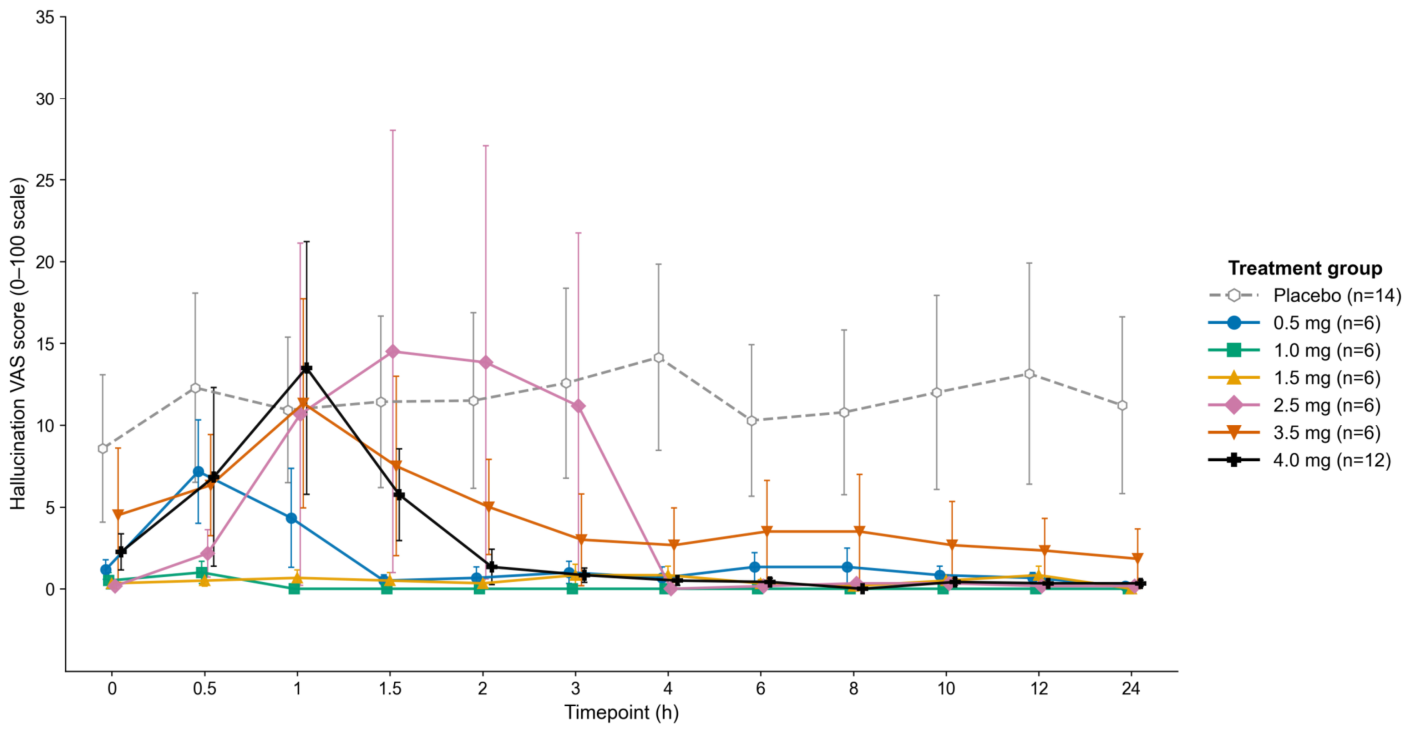
Figure 5
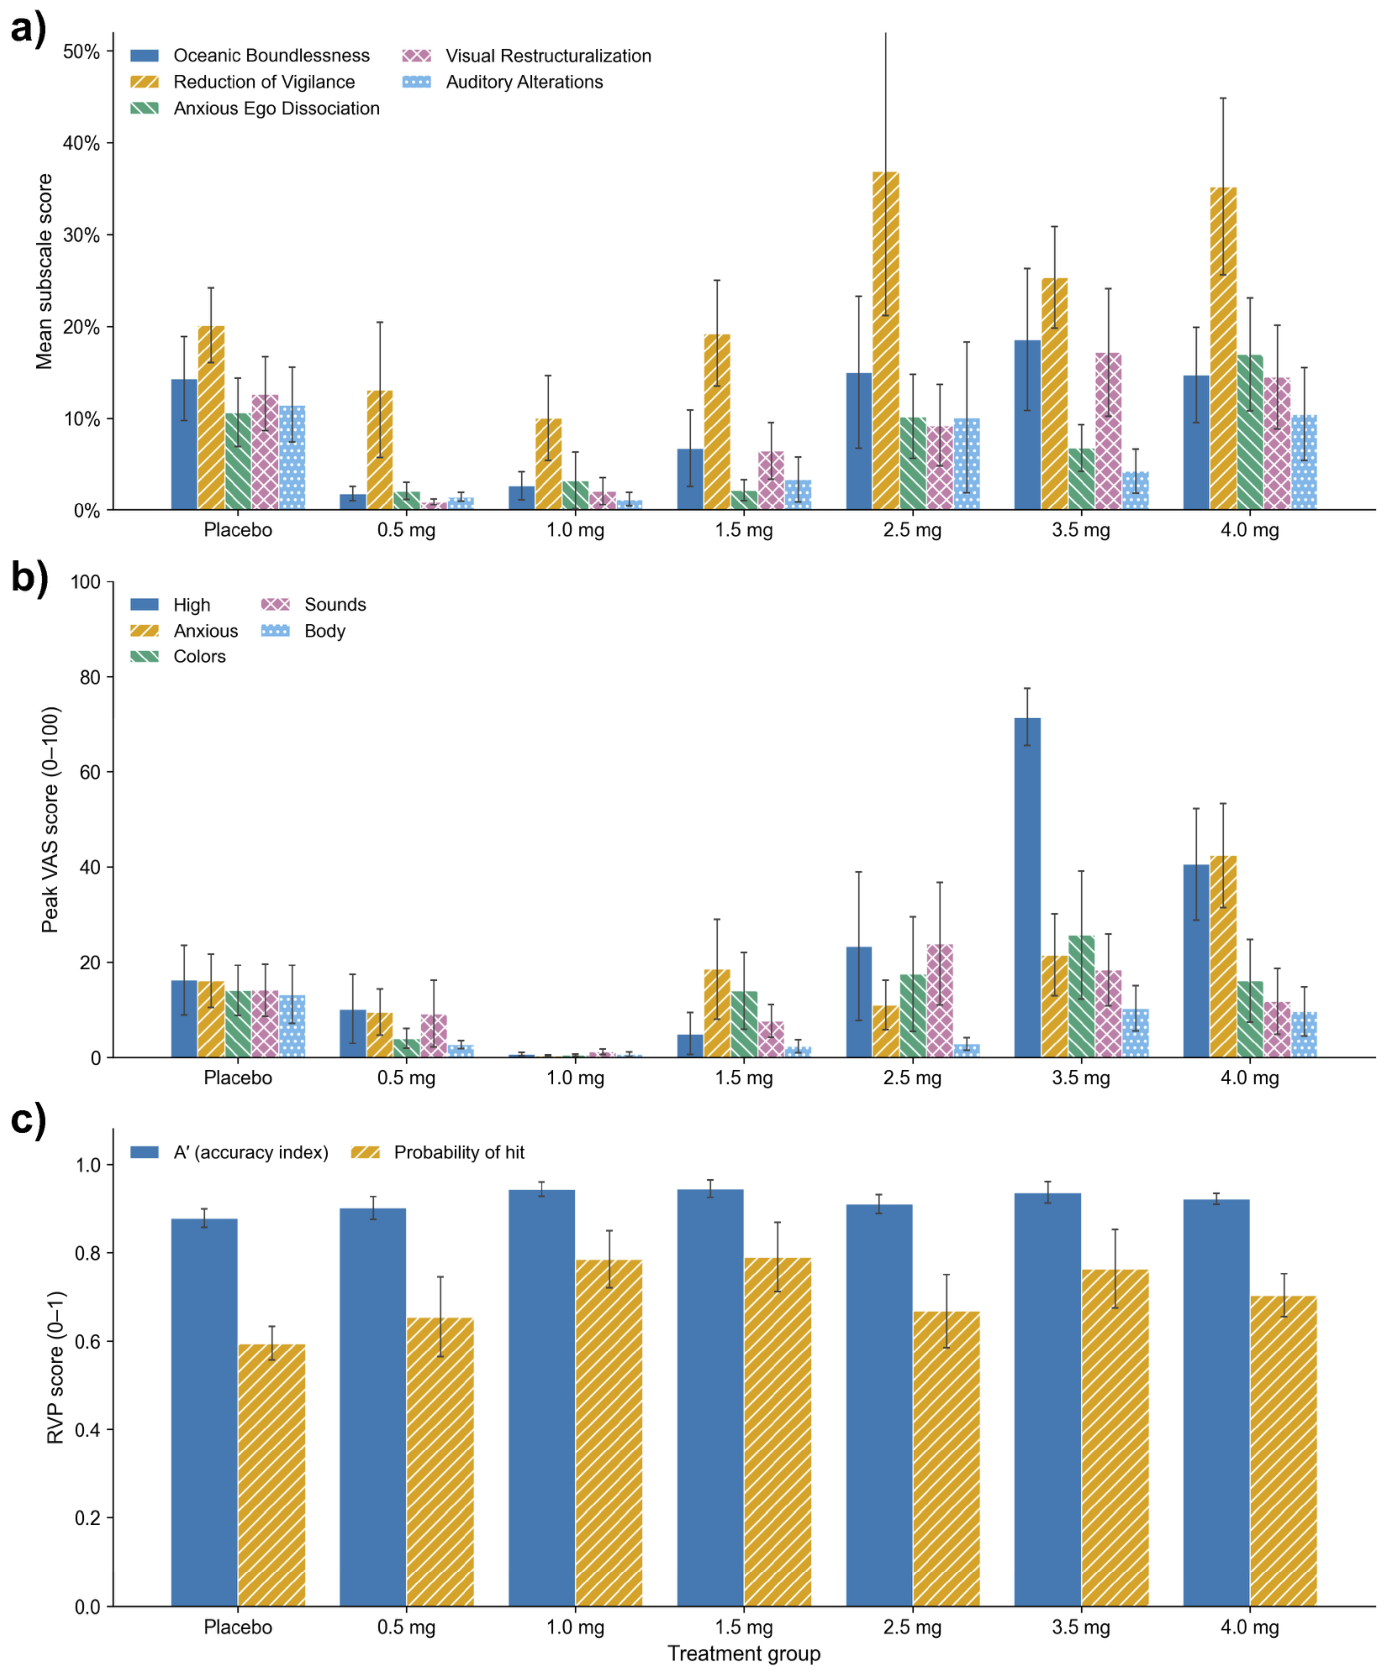
Figure 6
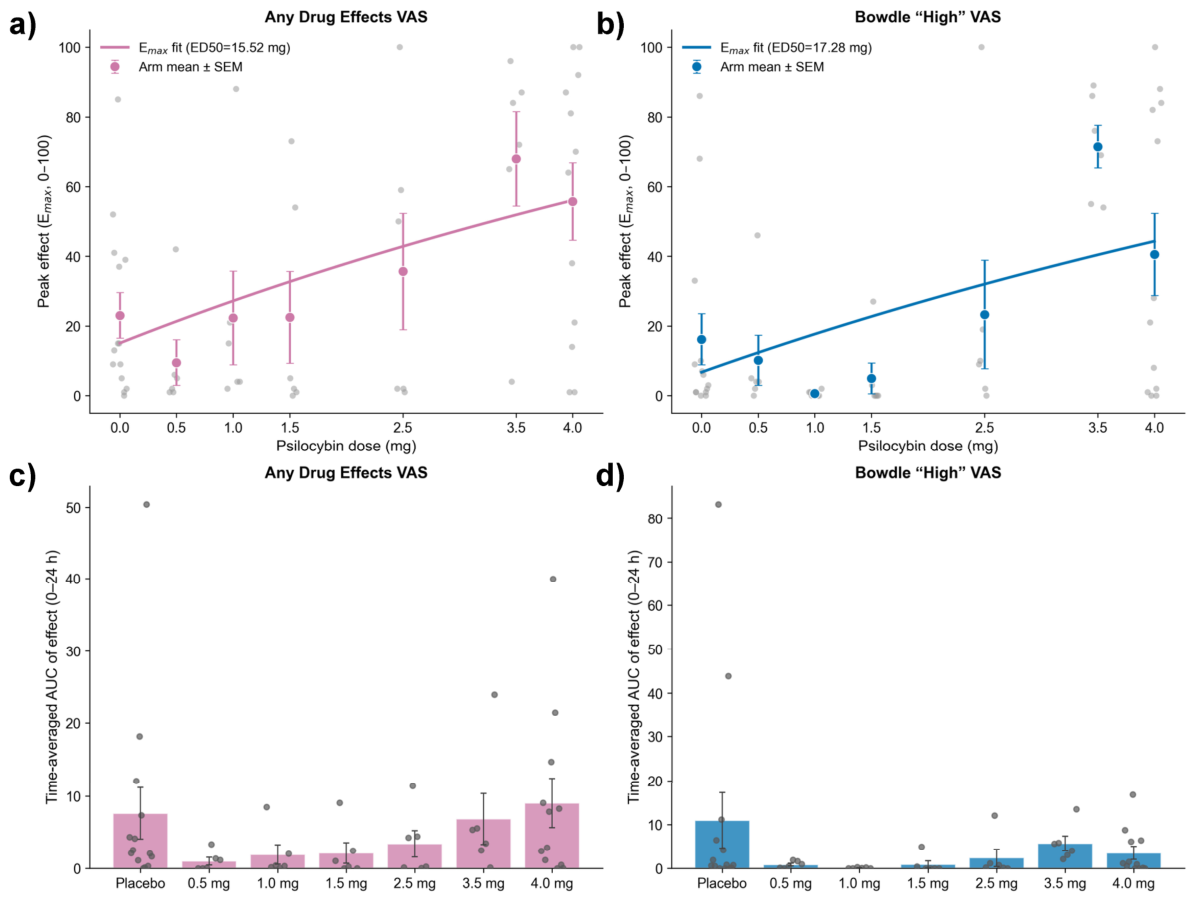
Figure 7
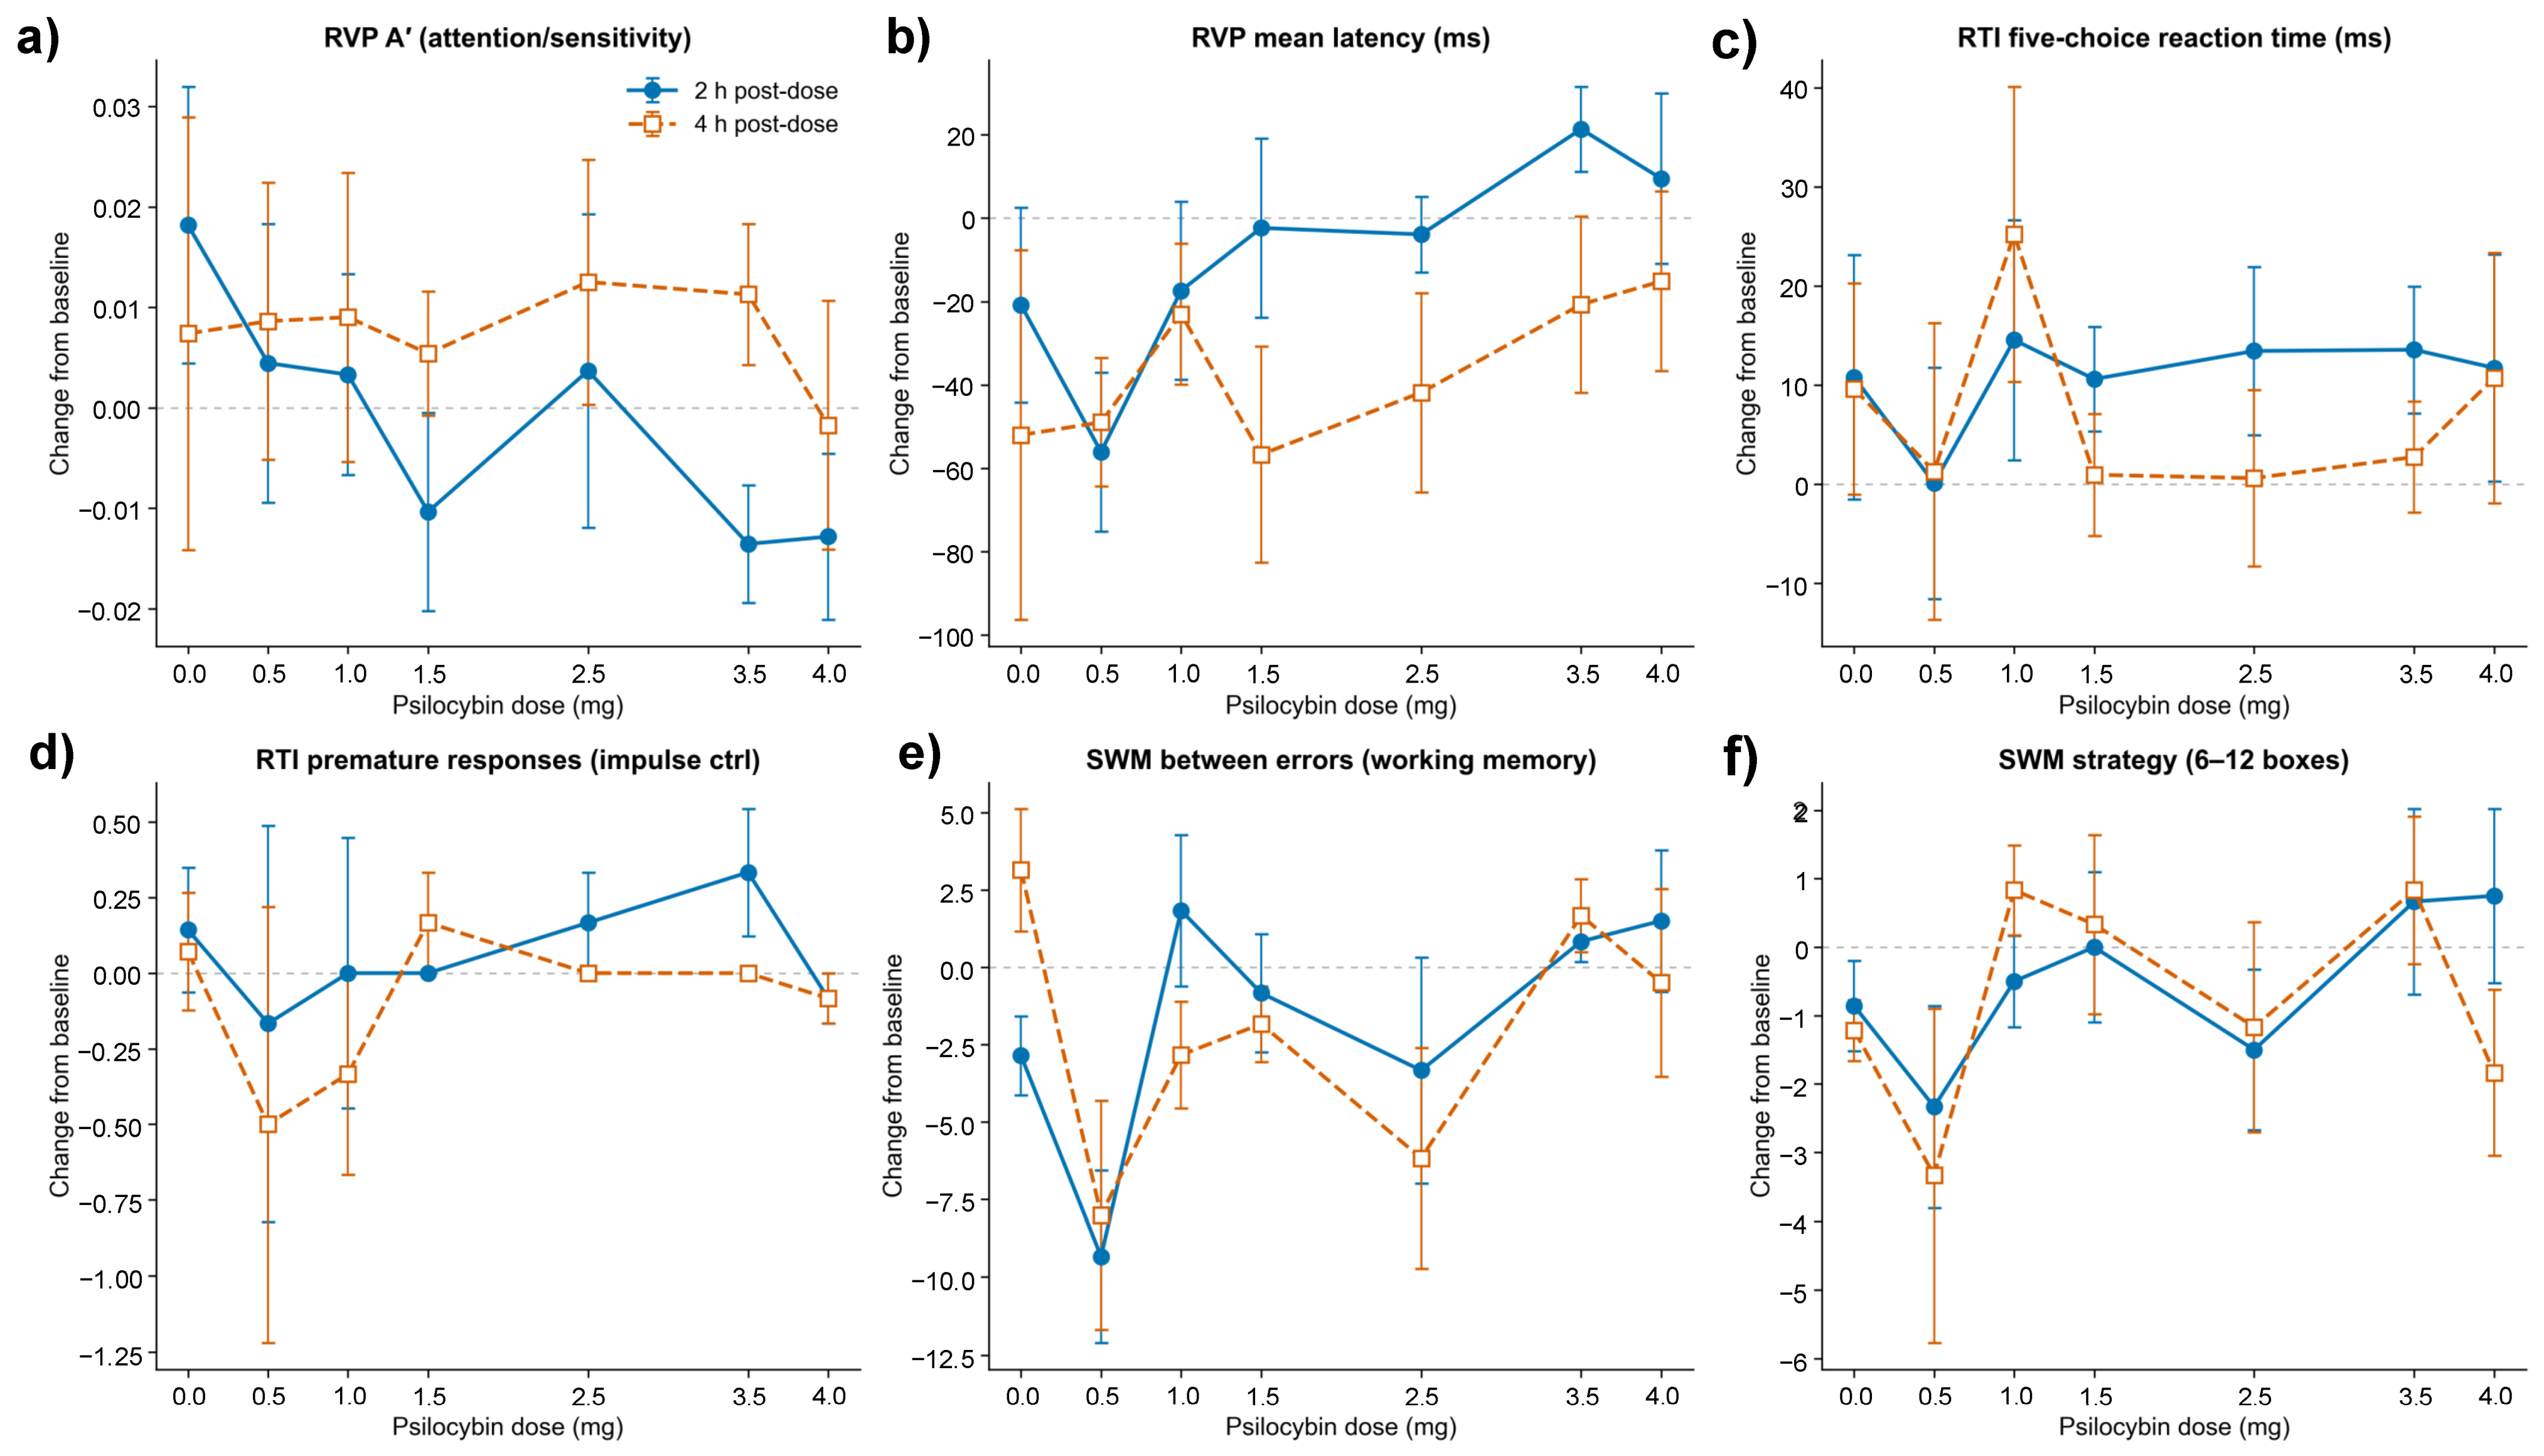
Figure 8
Sources · Attribution · Downloads
Read the paper and join the discussion
Naama Levy-Cooperman, Edward Sellers, Paul Glue, Isabella Szeto, David Brown, Jamie Jarecki-Smith, William J. Tyler and Michael B. McDonnell. Pharmaceuticals 2026, 19(9), 1496. DOI: 10.3390/ph19091496.
© 2026 the study authors. Abstract, figures, captions, tables and PDF reproduced under CC BY 4.0. Layout adapted; numerical values and original figure content retained. The pupil summary is transcribed from Section 2.7, with omissions and the visual discrepancy noted above.
Analysis prepared with AI assistance under the editorial direction of u/NeuronsToNirvana, 28 Sep 2026. This is an explanatory reading of one paper, not an independent replication or a dosing recommendation.