
Research Source Extract · Curated 2 November 2026
LSD Reconfigures Cortical Dynamics
Faster Brain Rhythms, Lower Oscillatory Power & Greater Complexity
Venkatesh Subramani and colleagues · Communications Biology 9, 1244 · Published 7 October 2026
Abstract
Lysergic acid diethylamide (LSD) profoundly alters conscious experience, yet the electrophysiological mechanisms by which it reshapes neural dynamics remain incompletely understood. A hallmark of psychedelic states is widespread cortical desynchronization, typically inferred from reductions in spectral power, but whether such effects reflect genuine weakening of neural oscillations or are confounded by shifts in oscillatory peak frequencies remains unresolved. We combine source-resolved magnetoencephalography (MEG), spectral parameterization, temporal complexity metrics, and interpretable machine learning in an LSD versus placebo design, with and without music. We show that LSD induces robust, spatially structured increases in alpha and beta peak frequencies alongside genuine attenuation of oscillatory power, with partly dissociable cortical patterns. Beyond rhythmic activity, LSD is associated with flattening of the aperiodic 1/f spectral slope and increased neural signal fractality and complexity, preferentially affecting sensory, language, emotion, and imagery-related networks while sparing motor cortex. Machine-learning analyses identify peak-frequency shifts, aperiodic parameters, and complexity measures as key discriminators of the psychedelic state. Music does not robustly amplify these neural signatures and instead shows a trend toward attenuation. These findings provide an electrophysiological account of how LSD reorganizes large-scale human brain dynamics and highlight features that may differentiate its neural signature from other psychedelics.
Introduction
Psychedelics are potent psychoactive compounds that elicit profound alterations in conscious experience, spanning heightened sensory perception, vivid imagery, and distortions in the sense of self1. Beyond their characteristic phenomenology, these compounds offer a powerful experimental lever for perturbing large-scale brain dynamics and probing the neural mechanisms by which the brain gives rise to mind2,3,4,5. Psychedelics have been used in rituals and cultural settings for thousands of years6, often alongside music7. Classic psychedelics—including psilocybin, N, N-dimethyltryptamine (DMT), and lysergic acid diethylamide (LSD)—exert their profound effects primarily through agonism at the 5-HT2A receptor. Among these, LSD is uniquely characterized by its additional affinity for dopaminergic receptors8, its extreme potency (producing effects at remarkably low doses), and its extended receptor kinetics. Despite these well-known pharmacological properties, the precise manner in which LSD perturbs cortical dynamics—spanning oscillatory rhythms, aperiodic spectral structure, and temporal signal complexity—and how these effects are shaped by sensory stimuli, such as music, remains poorly understood.
Modern neuroimaging has played a central role in uncovering how psychedelics alter large-scale brain function and core aspects of conscious experience, a process thought to support their therapeutic effect5,9,10. These mechanisms have been investigated across different modalities, including positron emission tomography (PET)11, functional MRI (fMRI)12, electroencaphelography (EEG)13, and magnetoencephalography (MEG)14. fMRI has been especially influential in understanding the psychedelic state (e.g., ref. 15). However, the fMRI signal reflects neural activity only indirectly via blood oxygenation, and psychedelics strongly modulate neurovascular processes16. As a result, psychedelic-induced BOLD changes may partly reflect disruption in neurovascular coupling rather than neural dynamics per se16. Although simultaneous EEG-fMRI studies are beginning to address these issues17, direct electrophysiological measurements remain essential for capturing the fast-changing dynamics that characterize the psychedelic state.
M/EEG provides a direct measurement of the brain’s electrophysiological activity at a millisecond scale, allowing precise characterization of oscillatory dynamics18,19. Early electrophysiological studies revealed a robust broadband desynchronization under psychedelics—including psilocybin14, LSD12, and DMT13. However, the spectral power of the neural signals reflects a mixture of periodic (oscillatory) and aperiodic (1/f-like) components20,21, and changes in one component can be misattributed to the other, leading to an ambiguous interpretation of spectral power. This has motivated a shift toward explicit spectral parameterization to separately quantify rhythmic and arrhythmic activity13,22,23. While broadband desynchronization appears as a robust, cross-psychedelic effect12,13,14, emerging evidence suggests that LSD may additionally modulate spectral peak frequencies. Carhart-Harris and colleagues12 reported subtle shifts in the alpha peak in posterior MEG sensors, a modulation not reported for DMT13 and only inconsistently for psilocybin23. These observations raise the possibility that frequency-specific perturbations, particularly within the alpha and beta bands, constitute a distinguishing signature of LSD relative to other serotonergic psychedelics. Yet, existing studies have not mapped how these peak-frequency shifts are organized across the cortex, leaving the spatial expression of oscillatory power reduction, as well as alpha- and beta-peak modulation, an open question in psychedelic neuroscience. Importantly, traditional analyses using fixed canonical bands can produce misleading results when oscillatory peaks shift. Because the power spectrum follows a 1/f-like decay, a peak that shifts upward may appear to lose strength simply because it is measured against a lower baseline, erroneously suggesting a desynchronization when the oscillation has merely changed frequency. To our knowledge, no previous study has analyzed LSD-induced spectral power changes while taking the peak shifts into account.
Music is a powerful sensory stimulus that shapes perception, emotion, and internal experience24,25. Historically and across cultures, it has accompanied ritual practices and psychedelic experiences, suggesting a close relationship between music and altered states of consciousness. The heightened sensory perception and mood characterizing the psychedelic state synergize with and potentiate music’s evocative power. Music, therefore, serves as a potent contextual factor that shapes internal experience and provides a useful framework for investigating altered brain dynamics26,27. Set (Mindset) and Setting (surrounding factors) play a crucial role in a psychedelic trip28. Music has emerged as a particularly influential setting variable and its usefulness in psychedelic-assisted therapy is now fully recognized29,30. Empirical studies have shown that music under psychedelics increases emotional response31, enhances mental imagery32, supports meaning-making33. In addition, converging evidence suggests that emotional breakthrough and psychological insight may be more robust and clinically predictive dimensions of psychedelic experience 34,35,36,37,38,39. These constructs arguably capture tangible processes, such as affective release and cognitive restructuring, and may therefore offer a more direct bridge between phenomenology and underlying neurobiology. Despite this extensive phenomenological and therapeutic work, the neural mechanisms underlying these effects remain poorly understood. While M/EEG studies have shown attenuated top-down suppression of prediction error under LSD during basic auditory processing 40—and increases in the richness of the neural signal during music listening 41, a mechanistic account of how music modulates the oscillatory and temporal dynamics of the psychedelic brain is yet to be established.
Beyond their effects on spectral structure, psychedelics are known to alter the temporal complexity of neural activity. Lempel-Ziv complexity (LZC), a prominent metric in psychedelic research, quantifies the diversity of neural signals by measuring the rate at which unique temporal patterns appear, effectively indexing the richness of the time series. Numerous studies consistently reported an increased LZC under psilocybin, LSD, and DMT13,23,41,42. In contrast, measures of fractality, such as the Higuchi fractal dimension (HFD), quantify the degree to which brain dynamics are self-similar across time scales, capturing scale-free temporal structure. It therefore complements LZC by revealing how complexity is organized across scales rather than how novel the signal is over time. HFD has been applied in other altered states of consciousness43, but has received far less attention in psychedelic research. Recent work suggests that psychedelic-induced rise in complexity can be modulated by external context, such as whether one attends to a stimulus or not41. This raises another question we address in the present study: to what extent are LSD-induced changes in temporal complexity intrinsic to the drug state, and to what extent are they shaped by structured sensory input, such as music?
Machine learning (ML) offers a data-driven framework for distinguishing brain states and has been successfully applied to EEG and MEG data across a range of altered states, including anesthesia44, meditation43, sleep modulation45, and psychedelic drug effects46,47. Beyond classification accuracy, ML models can provide insights into the neural features that drive differences in drug states, particularly through feature-importance analyses. Such approaches offer a complementary perspective to traditional group-level statistics by highlighting neurophysiologically meaningful variables that contribute most strongly to discriminability. In this study, we leverage interpretable ML to characterize how LSD—and its interaction with music—manifests in large-scale cortical dynamics.
In this study, we ask three questions: (Q1) To what extent does LSD produce region-specific modulations of the peak frequency of neural oscillations within the alpha and beta bands? (Q2) To what extent does LSD modulate the power of alpha and beta oscillations once the confounding effects of peak frequency shifts are accounted for? (Q3) Does music modulate LSD-induced alterations in neural temporal organization, including oscillatory dynamics and signal complexity? To address these questions, we apply spectral parameterization, oscillatory peak-frequency analysis, and temporal complexity metrics (LZC and HFD) to source-reconstructed MEG data collected under LSD and placebo (PLA) conditions, with and without music. We further use machine-learning models to quantify the discriminative value of these features. Based on prior work and the mechanistic considerations outlined above, we formulated three hypotheses: (H1) LSD induces region-specific shifts in oscillatory peak frequencies; (H2) LSD induces genuine attenuation of oscillatory power independent of peak-frequency shifts; (H3) music potentiates LSD-induced neural effects by amplifying changes in oscillatory organization and temporal complexity.
Five Original Figures
Open each panel to view the figure and its original caption. Select the image for the publisher’s full-size version.
Fig. 1: Overview of the preprocessing pipeline.
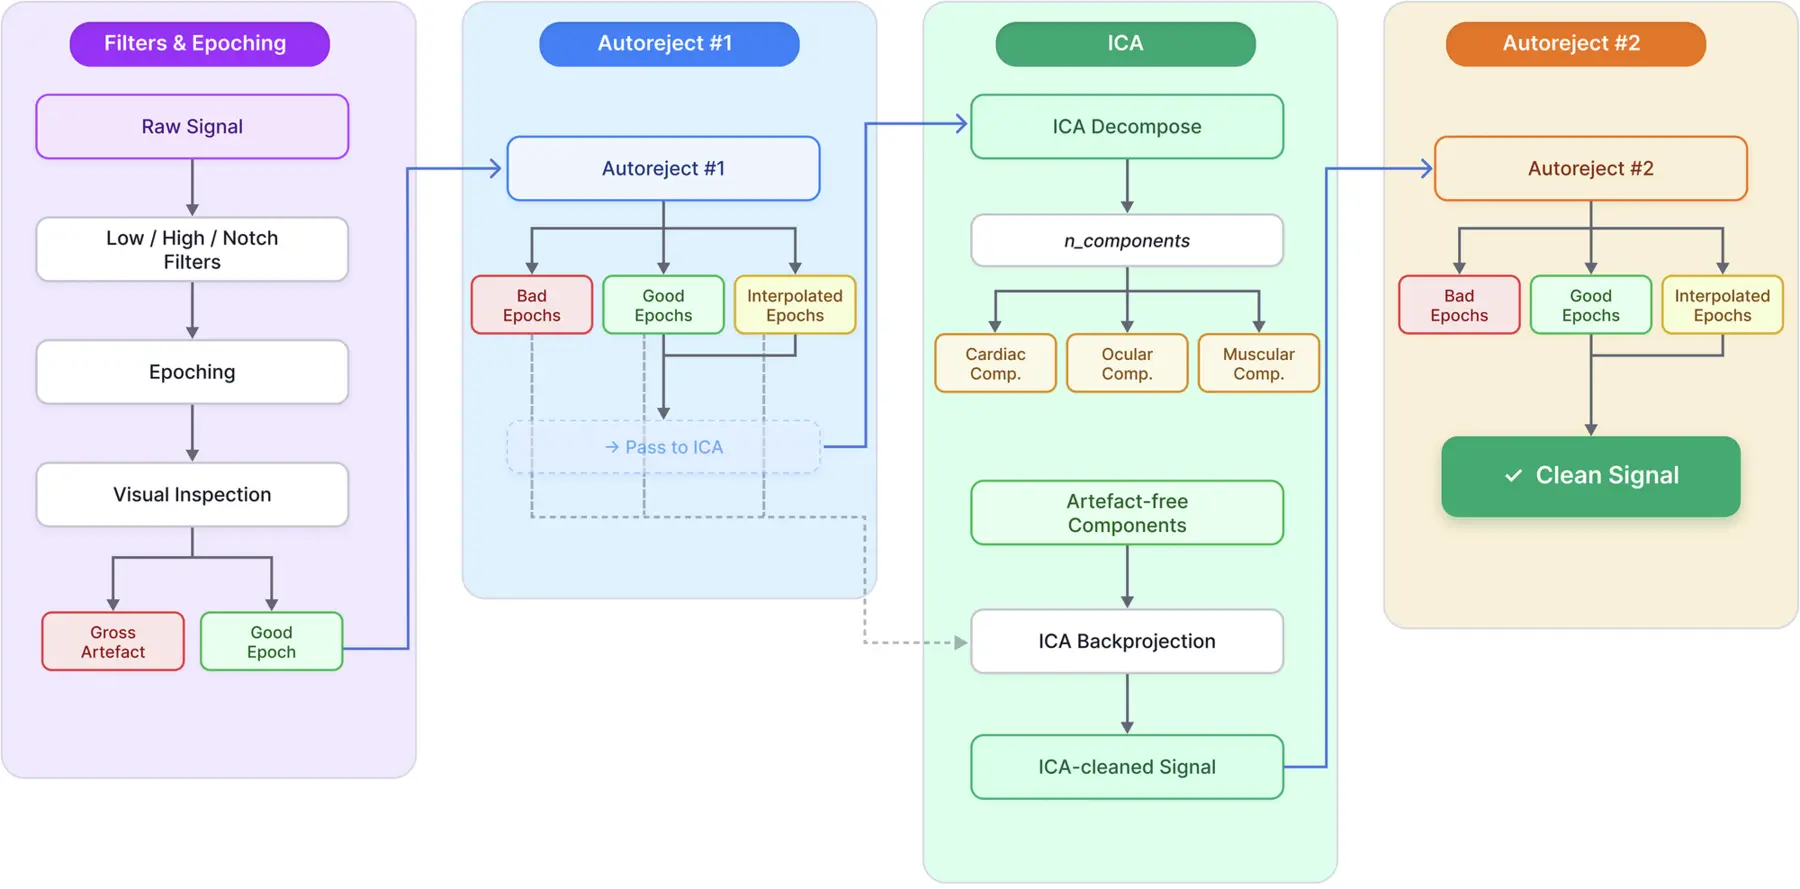
The pipeline begins with filtering, visual inspection, and segmentation of the continuous MEG signal into 2-s epochs, following the procedure of Carhart-Harris et al.12. Subsequent cleaning is performed using a quasi-automated, three-stage workflow. In the first stage, Autoreject is applied in mask-only mode to identify bad epochs while preserving the full dataset for later reconstruction. The good and interpolated epochs are then subjected to ICA decomposition. Components reflecting cardiac, ocular, or muscular artifacts are removed, and the remaining components are back-projected onto all epochs (good, interpolated, and previously flagged), producing an “ICA-cleaned” signal. Because residual artifacts may persist after ICA back-projection, a second Autoreject pass is performed to reject any remaining contaminated epochs, yielding the final cleaned dataset.
Fig. 2: Global and region-resolved spectral effects of LSD (Main Effect Drug).
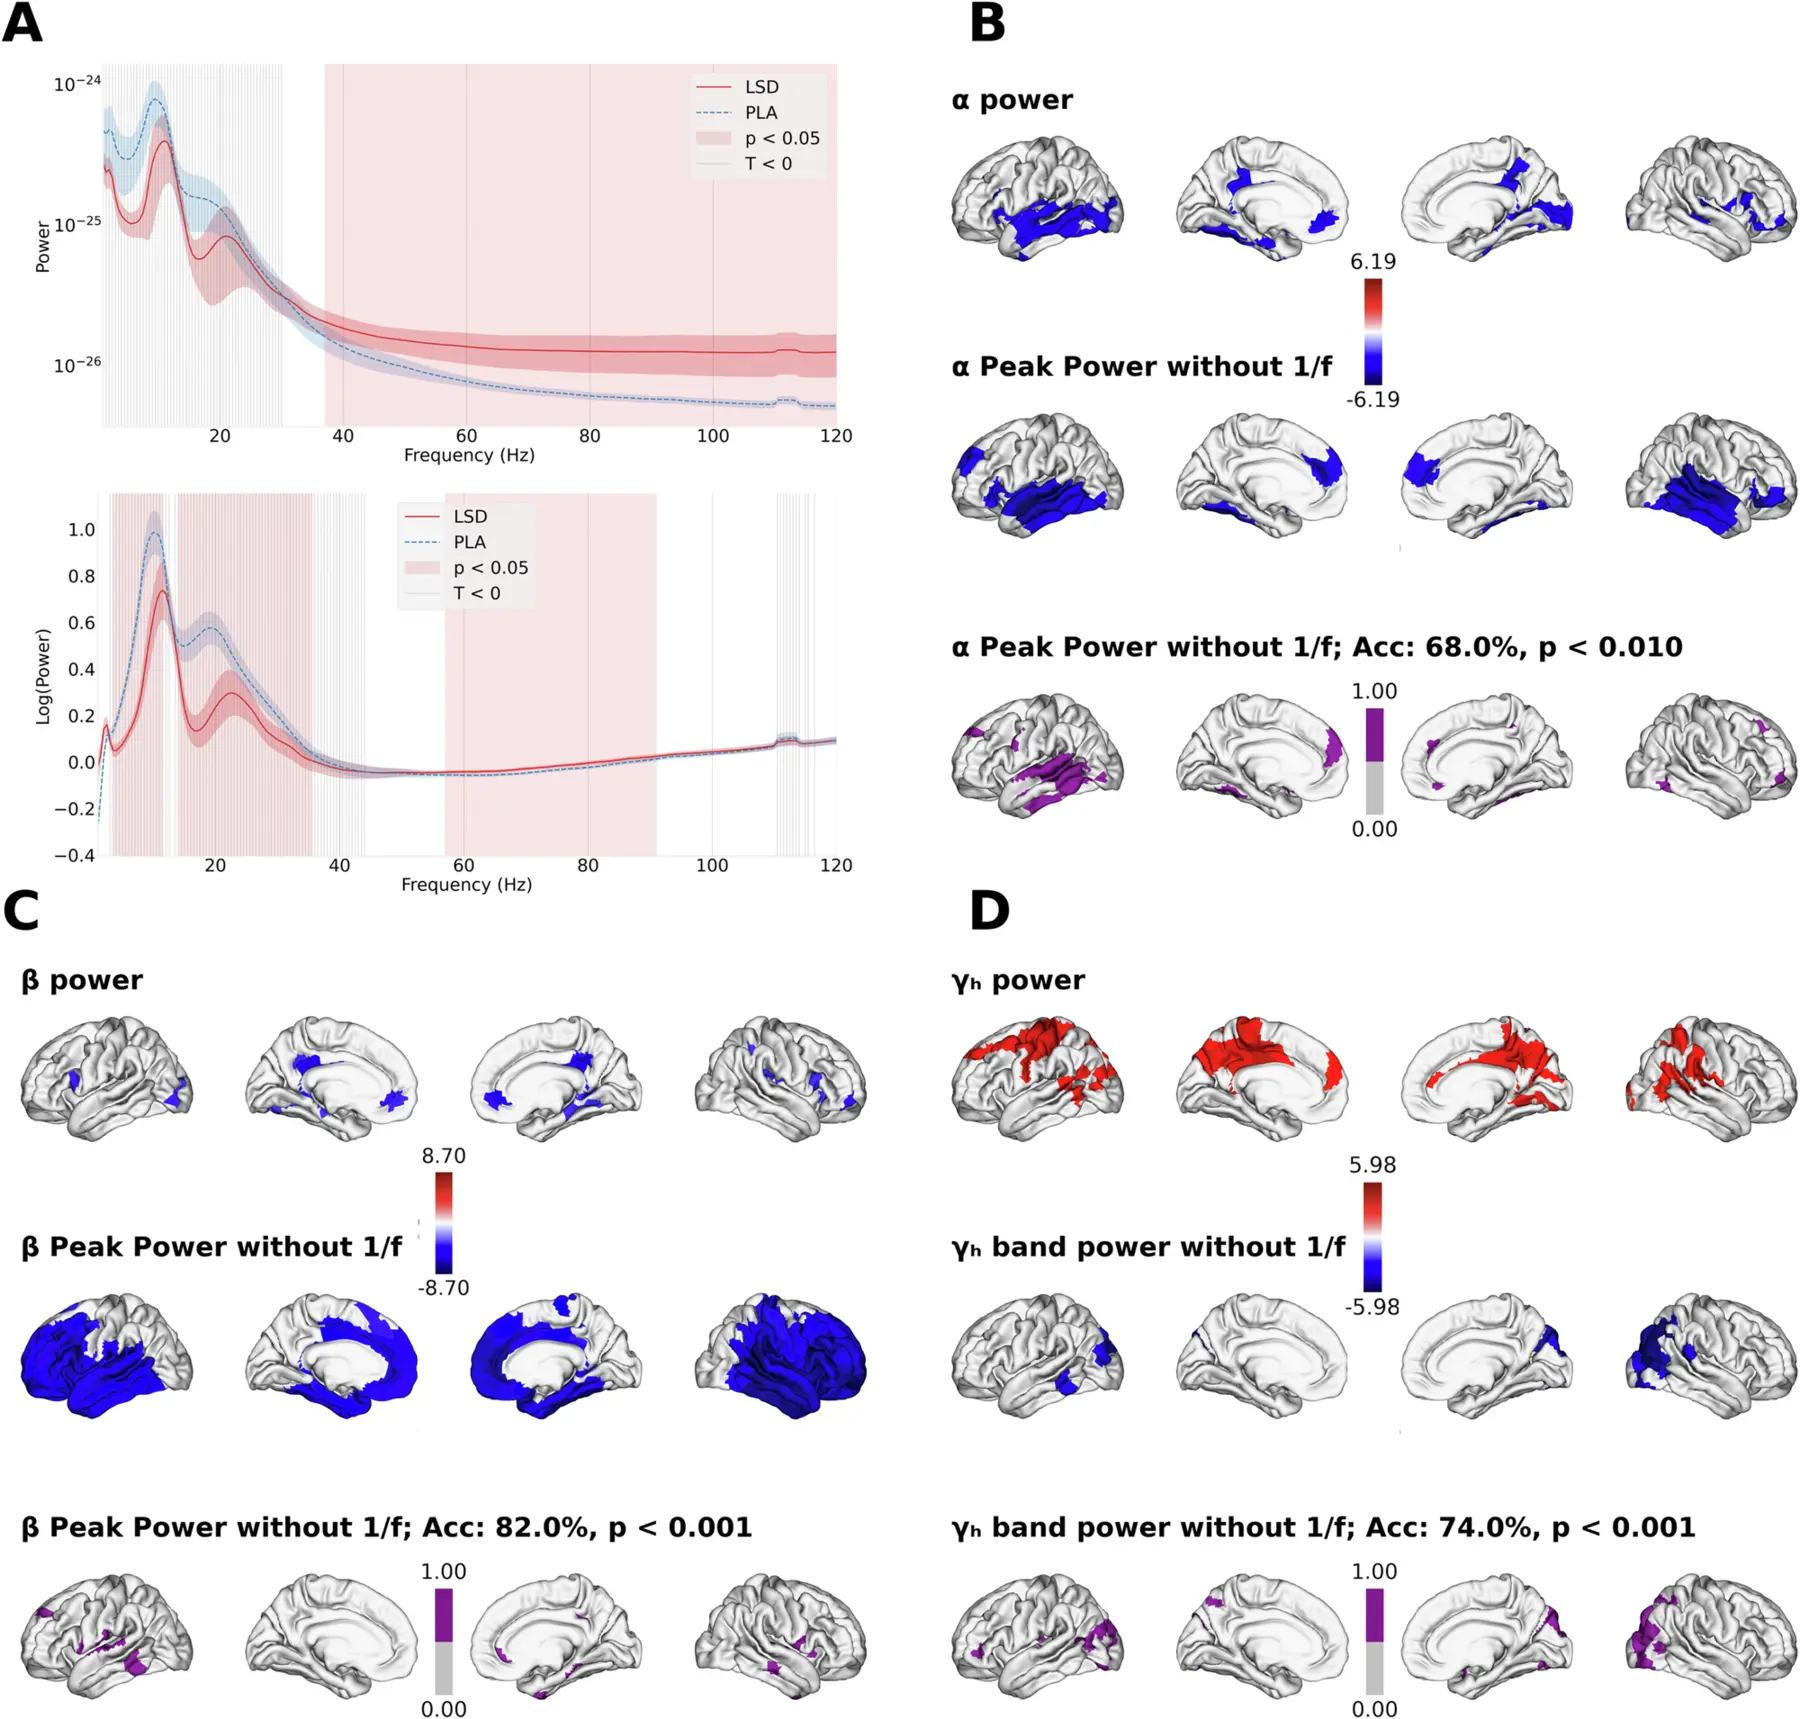
A Region-averaged power spectra before spectral parameterization ("raw spectrum'', top) and after removing the aperiodic component ("oscillatory component'', bottom). Gray vertical bands indicate frequency ranges where LSD < PLA (dashed line); red shading indicates statistically significant differences (cluster-corrected, p < 0.05). B–D Regional effects of LSD on α (B), β (C), and high-γ (D) activity. For each band, the first row shows the contrast maps (permutation-corrected, p < 0.05) for power within the canonical frequency band (α, β, γ) when the aperiodic (1/f) component is retained. The second row for α and β shows contrast maps for power at the oscillatory peak, after isolating periodic activity via spectral parameterization. The contrasts for high-γ correspond to changes in bandlimited oscillatory power. The third row displays permutation-corrected machine-learning feature-importance maps from models decoding LSD vs placebo using Peak Power features. Highlighted regions indicate strong contributions to classification. Decoding accuracies are cross-validated and permutation-corrected.
Fig. 3: LSD-induced alterations in temporal and spectral electrophysiological features.
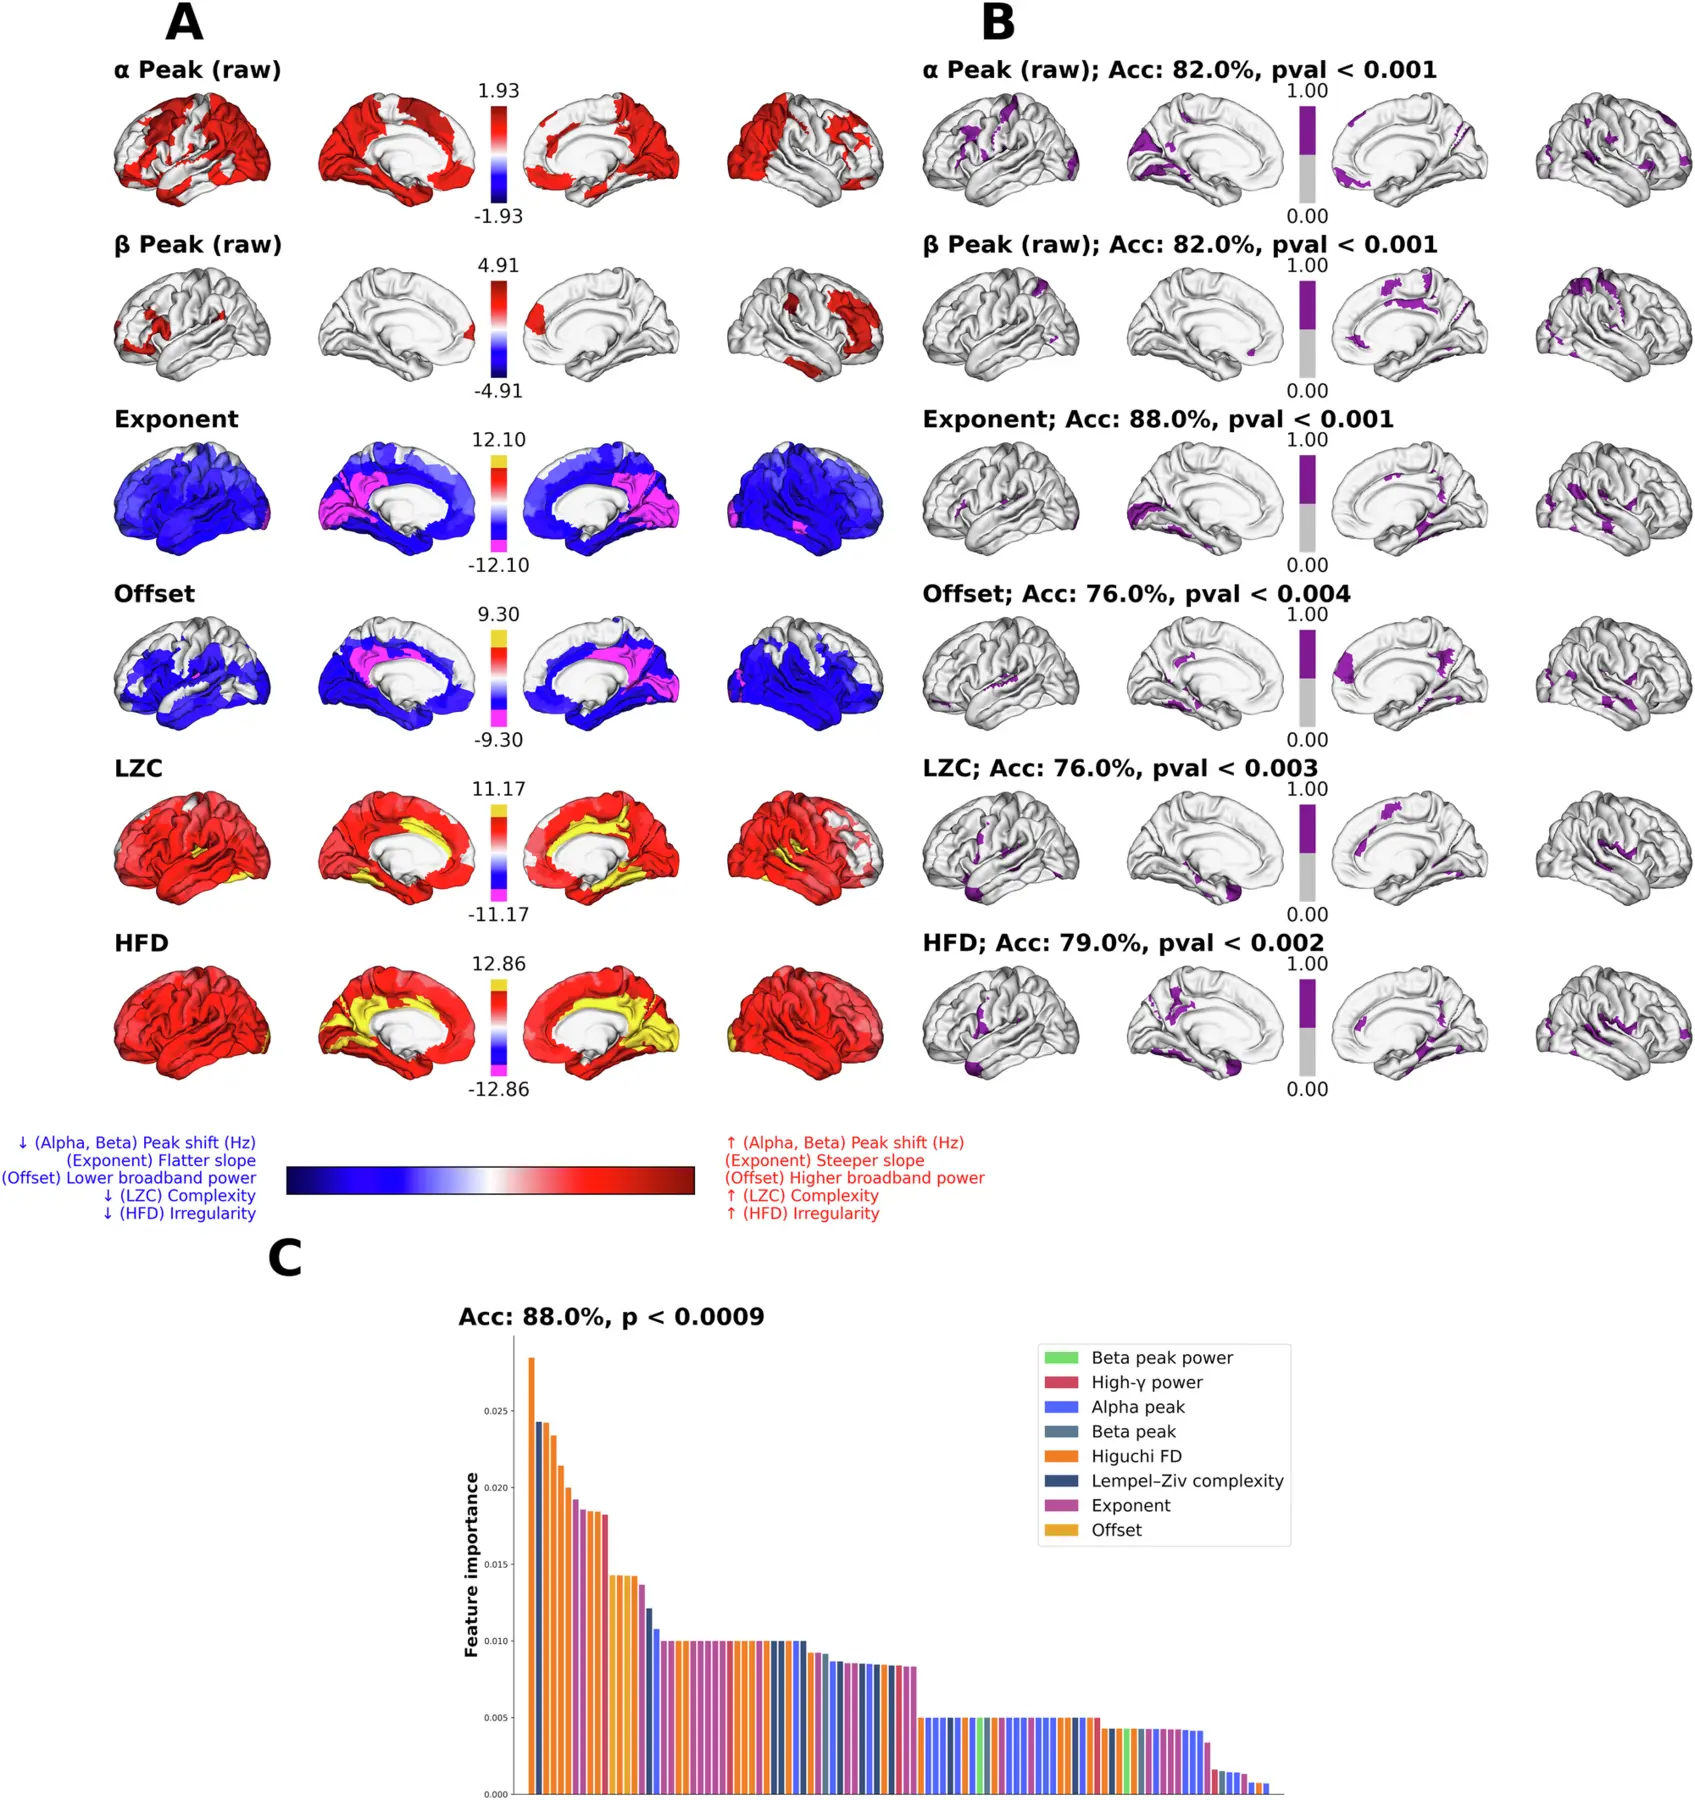
A Region-resolved LSD-PLA contrasts (permutation-corrected) for six features: grand-averaged LSD-PLA differences in α and β peak frequencies, each projected onto their respective significance masks; aperiodic exponent, aperiodic offset, Lempel-Ziv complexity (LZC), and Higuchi fractal dimension (HFD). For exponent, offset, LZC, and HFD, the color maps reflect t-statistics, and the strongest 10% of the regions are highlighted in yellow and magenta. The corresponding p value for the highlighted regions are by the colorbar (*** p < 10−3, ***** p < 10−5). B Machine-learning feature-importance maps (binarized) derived from Random Forest decoders trained to distinguish LSD from PLA based on each feature class separately. Significant regions are determined via permutation-testing of feature importances (1000 null-label permutations; p < 0.05). Classification accuracy and permutation-corrected p-values are reported for each feature. C Multi-domain decoding analysis using all feature families together. Bars represent permutation-corrected feature importances (regions) sorted in descending order and grouped by feature class, illustrating the relative contribution of each temporal-spectral marker to the LSD vs. PLA classification.
Fig. 4: Functional Decoding of LSD-induced electrophysiological changes using NiMARE.
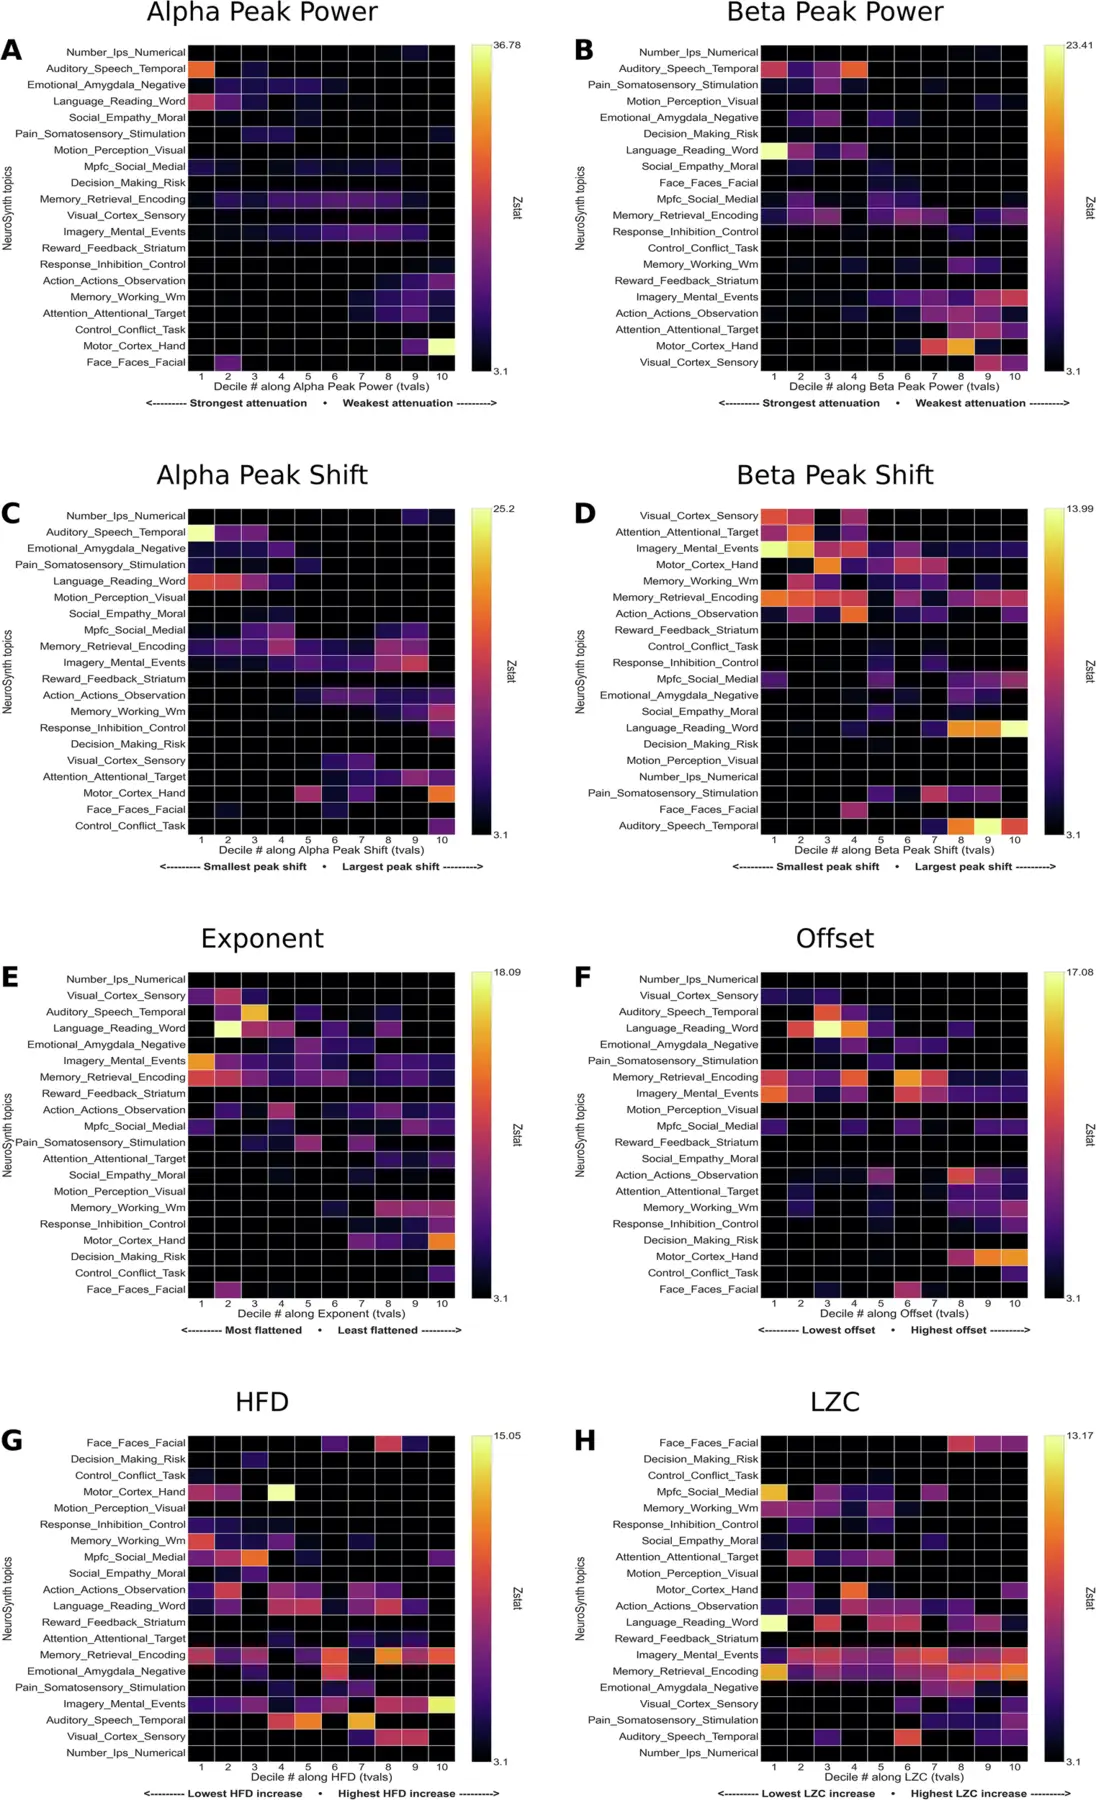
Binned (deciles) contrast maps (LSD-PLA) were used to identify how cognitive and affective systems are related to the drug-induced changes. A Alpha Peak Power, B Beta Peak Power, C Alpha Peak Shift, D Beta Peak shift, E 1/f slope, F Offset, G Fractality (HFD), H Complexity (LZC).
Fig. 5: Interaction effects of drug x music.
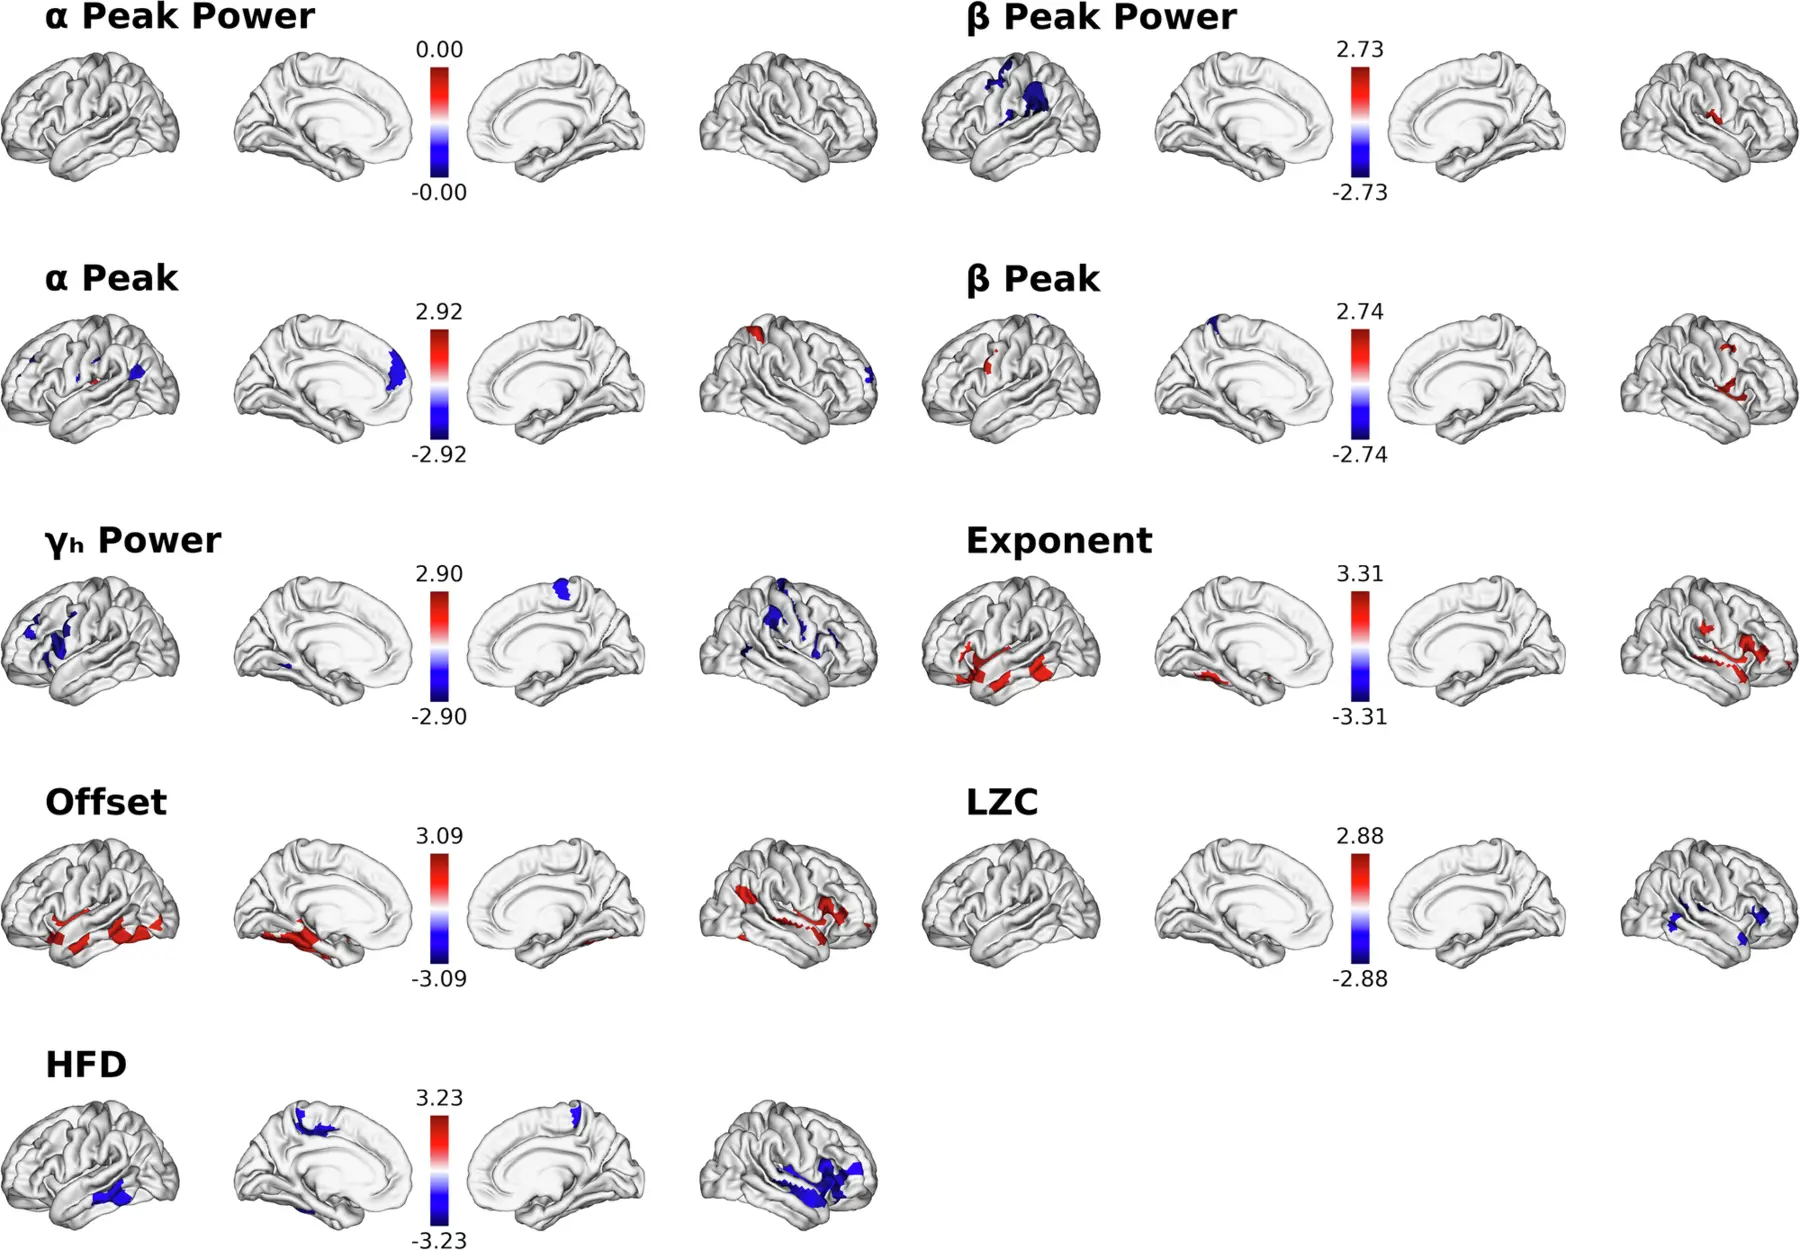
Statistical contrasts are presented for the different spectral and temporal features (p < 0.05, uncorrected).
Tables & Supplementary Material
No labelled tables appear in the main article or supplementary material. The supplement contains Figures S1–S8: subjective ratings, spectral model checks, oscillatory peak counts, power analyses, complexity, brain–experience regressions and classifier ROC curves.
Source & Reuse
Subramani, V., Nest, T., Pascarella, A. et al. LSD reconfigures cortical dynamics through faster brain rhythms and increased fractal dimension. Communications Biology 9, 1244 (2026). doi:10.1038/s42003-026-10629-7.
Abstract, introduction, figures and captions reproduced under Creative Commons Attribution 4.0. Source wording retained; layout adapted and figure images resized and compressed for web display. Citation numbers in the extracts link to the publisher’s reference list. The overview and limitations are AI-assisted AkashicNET editorial commentary. No author or institutional endorsement is implied.
Continue with Psychedelics, Context & Connection.