The Unit Of Work
A checked research note, corrected citation or useful answer. Counting generated words is insufficient.

AkashicNET · Expand² Inquiry · 3 November 2026
A living knowledge commons should account for the resources it uses, the people it affects and the value it actually creates.
01 · Question → Connections → Evidence → Outline → Prose → Refinement
AkashicNET aims to preserve provenance, show uncertainty, protect privacy and keep human judgement central. These are commitments that can guide design. Whether they produce better outcomes must be investigated.
A checked research note, corrected citation or useful answer. Counting generated words is insufficient.
Include generation, review, rework, builds and delivery. Record which resource categories remain outside the calculation.
Compare AI-assisted work with a realistic alternative: manual research, simpler software, reusing an asset or choosing not to produce it.
02 · Claims, Sources & Boundaries
Computation uses electricity. Cooling, electricity supply and hardware production can require water and materials. Resource demands and burdens vary by location and system design.
UNEP lifecycle assessment ↗Boundary: This establishes categories of impact, not AkashicNET’s quantities.
Luccioni and colleagues report a mean of 2.907 kWh per 1,000 image inferences across the models tested: approximately 2.9 Wh per image.
Luccioni et al., FAccT 2024 · Table 2 ↗Boundary: A benchmark on selected models and hardware cannot directly measure this project’s image service.
Epoch AI’s 2025 analysis estimates about 0.3 Wh for a typical GPT-4o query and much higher use for very long inputs. Our research and coding involve documents, repeated calls and potentially lengthy reasoning.
Josh You, Epoch AI · 2025 ↗Boundary: These are modelled estimates for another system. The calculator’s per-call values are user-editable assumptions, not validated current-model measurements.
The ILO’s 2025 index estimates some generative-AI exposure in occupations employing one in four workers worldwide. It expects transformation to be more likely than complete replacement.
ILO · 2025 occupational exposure index ↗Boundary: Exposure is not observed job loss. AkashicNET has not measured its own effect on employment or income.
UNESCO identifies risks involving disinformation, privacy, surveillance, discrimination and copyright. Source attribution and human review are relevant safeguards.
UNESCO · Media and information literacy ↗Boundary: A safeguard’s presence does not demonstrate that it prevents harm in practice.
03 · An Editable Thought Experiment
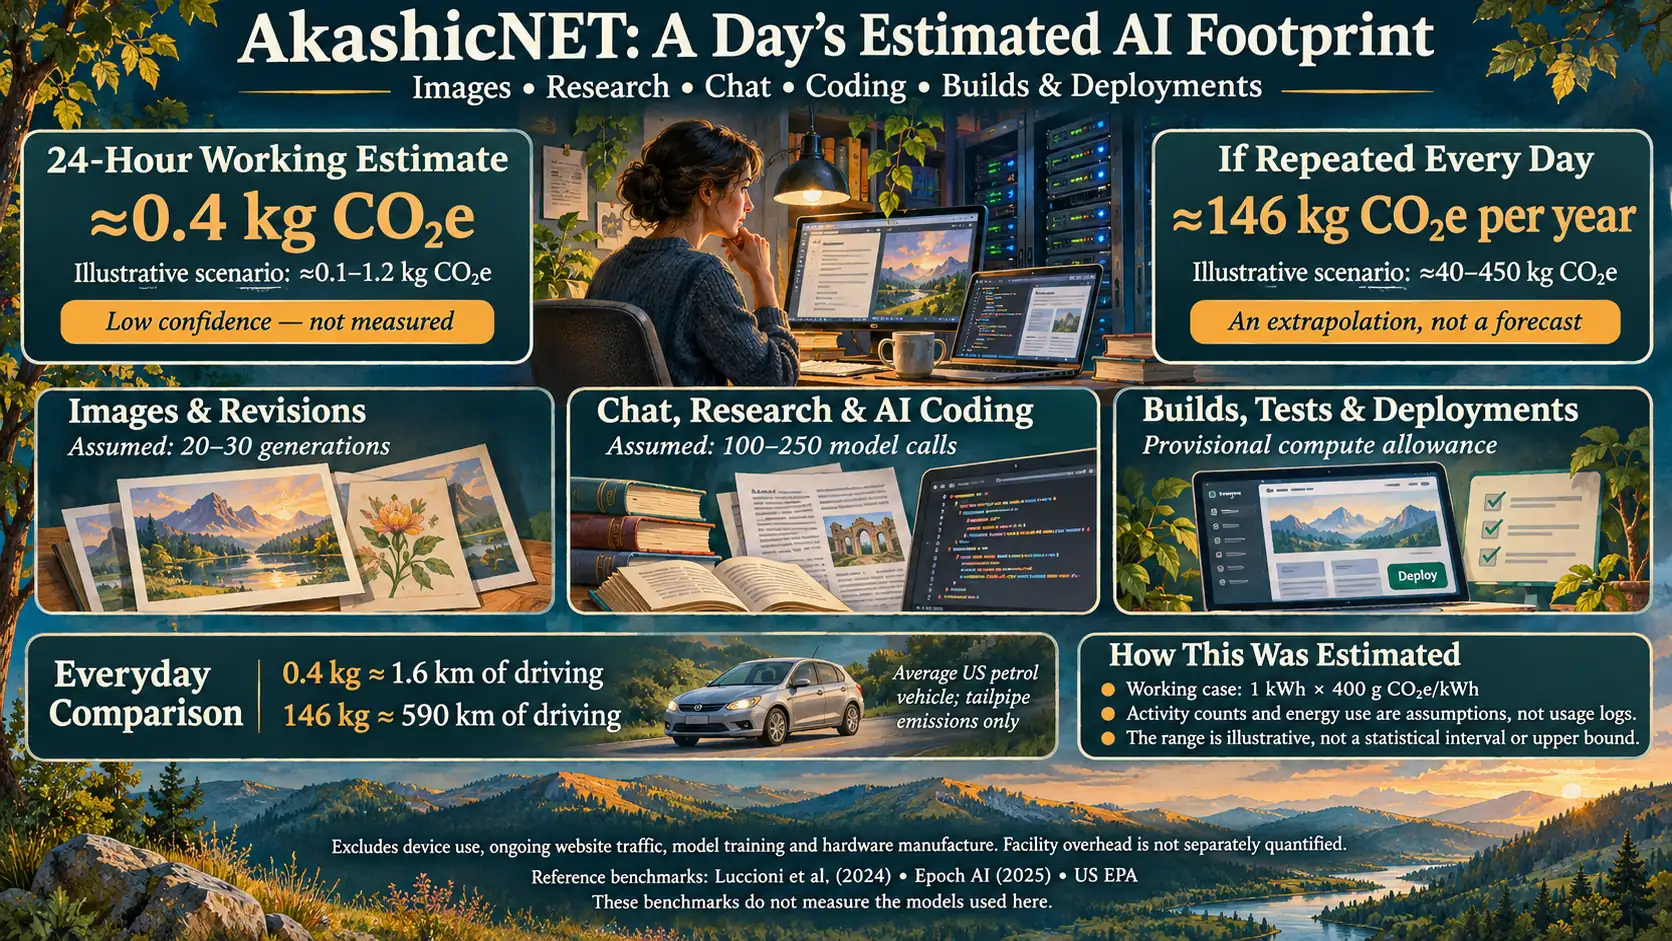
The worked example proposes approximately 0.4 kg CO₂e for a busy day. This is an illustrative scenario, not a reconstruction from a complete 24-hour usage log. The default below reaches that result through explicit assumptions. Its 20–30 image and 100–250 call allowances are not verified counts.
Provider-reported usage can replace assumed activity counts. Keep the original unit and its definition: credits, tokens and build minutes are different quantities. A usage log measures activity; it does not automatically measure energy.
| Usage Unit | What To Record | What Conversion Still Needs |
|---|---|---|
| Model tokens | Model/version, input, cached input, output and reasoning tokens where reported; avoid double counting reasoning already included in output | Compatible energy factors for that model, hardware and token category |
| Image generations | Model, size, quality, revisions and failed attempts where billed or logged | Energy per generation for that configuration |
| Build minutes | Runner type, duration, retries and concurrency | Allocated runner power and facility overhead |
| Hosting | CPU duration, memory, requests, storage and transfer, if available | Provider-specific factors and a declared allocation method |
| Credits or euros | Units consumed, service, date and applicable tariff | Tariff converts to money; energy requires a separate mapping |
Two separate ledgers: financial cost = usage units × applicable price; operational carbon = estimated electricity × electricity carbon intensity. A monthly subscription is not a per-task electricity measurement. Cache discounts are not evidence of an identical percentage energy saving.
The calculator currently uses counts and energy allowances. Replace the counts with reported usage when available. Token-level estimates should be added only with explicitly sourced conversion factors; no universal token-to-carbon factor is assumed here.
Editable Scenario · No Usage Telemetry
((25 × 6) + (150 × 5) + 100) Wh × 1 ÷ 1,000 × 400 g/kWh ÷ 1,000 = 0.4 kg CO₂e/day
Comparison: approximately 1.609 km of driving per day’s emissions, using the EPA’s 400 g CO₂/mile average US petrol-vehicle tailpipe factor. This comparison does not equalise lifecycle boundaries.
Scope: inference and build electricity assumptions only. Excludes device use, network delivery, ongoing website traffic, training and hardware manufacture. Facility overhead is included only to the extent represented by the multiplier; avoid adding it again if your supplied energy figures already include it. Carbon intensity is an assumption about the serving facility, not the user’s home location. No per-task water estimate is available.
Calculations run in your browser. Inputs are not sent or saved by this calculator. Displayed precision is arithmetic precision, not measurement certainty.
Low activity assumptions: 20 images × 3 Wh + 100 model calls × 2 Wh + 50 Wh of builds = 310 Wh. High assumptions: 30 × 10 Wh + 250 × 10 Wh + 300 Wh = 3,100 Wh. At 400 g CO₂e/kWh these give 0.124–1.24 kg/day, or approximately 45–453 kg/year if repeated for 365 days. Earlier prose rounded this to 0.1–1.2 kg/day and about 40–450 kg/year.
This interval is a sensitivity illustration, not a confidence interval, observed range or upper bound. Lower-carbon electricity reduces the result; more computation or higher-carbon electricity increases it.
04 · Widen Possibilities, Then Deepen Scrutiny
AI replaces more resource-intensive work while preserving quality. Test the alternative workflow and include review and correction.
Lower effort encourages more images, drafts and deployments. Efficiency per output improves while total use grows.
Knowledge access improves while resource use or other harms increase. Evaluate the trade-offs separately rather than declaring a single net benefit.
These explanations can coexist. Lower emissions do not establish fair labour practices; accurate citations do not establish environmental sustainability. Public value and environmental burden need separate evidence.
05 · Proposed Experiments · Not Yet Run
Compare reusing an existing illustration with generating a new one for similar articles.
Observe: Generation counts, production time, corrections and reader comprehension.
Decision: Fewer generations with comparable comprehension would support reuse.
Compare matched source-appraisal tasks with and without AI assistance; use the same rubric and a reviewer unaware of the condition.
Observe: Citation accuracy, unsupported claims, useful findings, review time and unresolved errors.
Decision: Higher output volume alone would not establish better research.
Compare a claim card with direct provenance and uncertainty against a summary of the same length without those features.
Observe: Ability to locate the source, identify limitations and distinguish findings from interpretation.
Decision: Improved source checking would support this design choice.
Compare a week of grouped changes with a comparable week of frequent small builds, while preserving urgent fixes.
Observe: Build minutes, failures, rework, delivery delay and service reliability.
Decision: Fewer build minutes without more failures would support batching.
06 · Accountability In Practice
Source links, visible uncertainty, human responsibility, accessible explanations and respect for creators.
Unnecessary regeneration, duplicate searches and avoidable build cycles. Reuse checked work when it serves the task.
Resource use, errors corrected, source-checking success and reader benefit. Do not infer benefit from publishing volume.
AkashicNET tries to use AI in service of shared knowledge and planetary care. Its net environmental benefit has not been established.
Project commitments → · Public data → · Frameworks → · Questions and corrections →
Prepared 3 November 2026 · Independent, human-directed, AI-assisted synthesis. Source links identify original work; they imply no affiliation or endorsement. No complete lifecycle audit or independently verified footprint is claimed.